
Page 127 - Mechanics of Asphalt Microstructure and Micromechanics
P. 127
Experimental Methods to Characterize the Heterogeneous Strain F ield 119
e x e y e z e xy e xz e yz
0.004 0.012 0.0038 0.0034 0.0109 0.023
TABLE 4.5 Macro-strain for one tetrahedron.
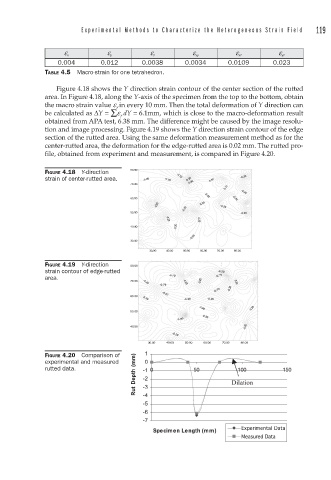
Figure 4.18 shows the Y direction strain contour of the center section of the rutted
area. In Figure 4.18, along the Y-axis of the specimen from the top to the bottom, obtain
the macro strain value e g in every 10 mm. Then the total deformation of Y direction can
Σ
be calculated as ΔY = e g dY = 6.1mm, which is close to the macro-deformation result
obtained from APA test, 6.38 mm. The difference might be caused by the image resolu-
tion and image processing. Figure 4.19 shows the Y direction strain contour of the edge
section of the rutted area. Using the same deformation measurement method as for the
center-rutted area, the deformation for the edge-rutted area is 0.02 mm. The rutted pro-
file, obtained from experiment and measurement, is compared in Figure 4.20.
FIGURE 4.18 Y-direction 80.00
strain of center-rutted area.
70.00
60.00
50.00
40.00
30.00
30.00 40.00 50.00 60.00 70.00 80.00
FIGURE 4.19 Y-direction 80.00
strain contour of edge-rutted
area.
70.00
60.00
50.00
40.00
30.00 40.00 50.00 60.00 70.00 80.00
FIGURE 4.20 Comparison of
experimental and measured
rutted data.