
Page 79 - Mechanics of Asphalt Microstructure and Micromechanics
P. 79
72 Ch a p t e r Th r e e
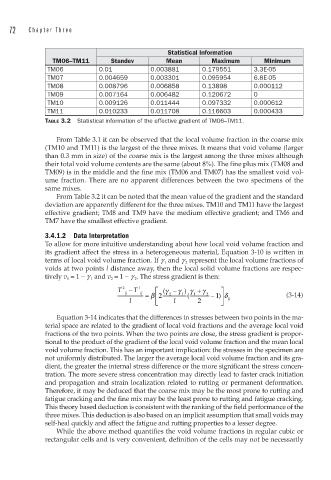
Statistical Information
TM06–TM11 Standev Mean Maximum Minimum
TM06 0.01 0.003881 0.179551 3.3E-05
TM07 0.004659 0.003301 0.095954 6.8E-05
TM08 0.008796 0.006858 0.13898 0.000112
TM09 0.007164 0.006482 0.120672 0
TM10 0.009126 0.011444 0.097332 0.000612
TM11 0.010233 0.011708 0.116603 0.000433
TABLE 3.2 Statistical information of the effective gradient of TM06–TM11.
From Table 3.1 it can be observed that the local volume fraction in the coarse mix
(TM10 and TM11) is the largest of the three mixes. It means that void volume (larger
than 0.3 mm in size) of the coarse mix is the largest among the three mixes although
their total void volume contents are the same (about 8%). The fine plus mix (TM08 and
TM09) is in the middle and the fine mix (TM06 and TM07) has the smallest void vol-
ume fraction. There are no apparent differences between the two specimens of the
same mixes.
From Table 3.2 it can be noted that the mean value of the gradient and the standard
deviation are apparently different for the three mixes. TM10 and TM11 have the largest
effective gradient; TM8 and TM9 have the medium effective gradient; and TM6 and
TM7 have the smallest effective gradient.
3.4.1.2 Data Interpretation
To allow for more intuitive understanding about how local void volume fraction and
its gradient affect the stress in a heterogeneous material, Equation 3-10 is written in
terms of local void volume fraction. If g 1 and g 2 represent the local volume fractions of
voids at two points l distance away, then the local solid volume fractions are respec-
tively v 1 = 1 − g 1 and v 2 = 1 − g 2 . The stress gradient is then:
T 2 − T 1 ⎡ γ ( − γ ) γ + γ ⎤
1 δ
ij ij = β ⎢ 2 2 1 ( 1 2 − ) ⎥ (3-14)
l ⎣ l 2 ⎦ ij
Equation 3-14 indicates that the differences in stresses between two points in the ma-
terial space are related to the gradient of local void fractions and the average local void
fractions of the two points. When the two points are close, the stress gradient is propor-
tional to the product of the gradient of the local void volume fraction and the mean local
void volume fraction. This has an important implication: the stresses in the specimen are
not uniformly distributed. The larger the average local void volume fraction and its gra-
dient, the greater the internal stress difference or the more significant the stress concen-
tration. The more severe stress concentration may directly lead to faster crack initiation
and propagation and strain localization related to rutting or permanent deformation.
Therefore, it may be deduced that the coarse mix may be the most prone to rutting and
fatigue cracking and the fine mix may be the least prone to rutting and fatigue cracking.
This theory based deduction is consistent with the ranking of the field performance of the
three mixes. This deduction is also based on an implicit assumption that small voids may
self-heal quickly and affect the fatigue and rutting properties to a lesser degree.
While the above method quantifies the void volume fractions in regular cubic or
rectangular cells and is very convenient, definition of the cells may not be necessarily