
Page 44 - Mechatronics for Safety, Security and Dependability in a New Era
P. 44
Ch07-I044963.fm Page 28 Tuesday, August 1, 2006 12:30 PM
Ch07-I044963.fm
28 28 Page 28 Tuesday, August 1,2006 12:30 PM
For example, The 3D-data of orthosis for the FEA provide a surface model. The element type used is
the Parabolic Triangle. Boundary conditions of load and restraint are determined at the heel-off point
in the gait cycle. Because of the size limit in the table of the stereo-lithography (Rapid Prototyping
System), we made models of the AFOs that were 50% in size. It took 12 hours to produce 2 models.
This time, although the resin like the property of polypropylene is being used for the orthosis of RPS,
it is necessary to develop a synthetic resin whose toughness and tenacity are fit for orthosis. The
shapes of AFO have been conventionally modified in such a way as to provide rigidity to the orthoses
through the inclusion of several cords under the plastic seat for stress relaxation. Three-dimensional
digitalized data, in contrast, can modify the shapes by using the Sweep Function. Permeability to air,
which has been sought after, can be obtained by this new method, hemiplegic stroke tend to show
involuntary movements and muscle spasms called "Clonus" in response to external stimulation. The
attachment of AFO is known to alleviate those spasms, but the process has not been elucidated fully
yet. When an orthosis is prescribed, the Brunnstrom method is applied in evaluating the grades of
paralysis. But the grade of paralysis is not a factor in the manufacture of the orthosis. And it is hard to
say that it is an orthosis suitable for the patient. The major purpose of this study is to be reflected in
the design method of the orthostic fitting each patient and to be quantified by measuring spastic
muscle action.
Methods
In order to measure the gait characteristics of spastic muscle action with hemiplegic stroke, the
Spastic Measurement Orthosis (SMO) was made. The measuring method was as follows: a load cell
was attached to the back of an orthosis, the ankle-joint was kept at 90 degrees by walking, and the
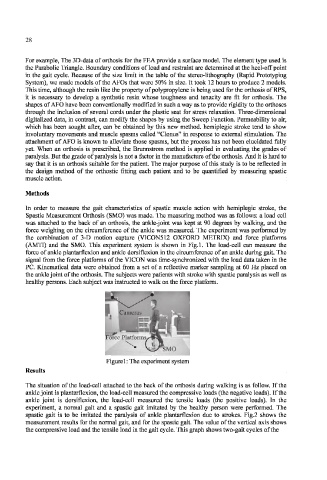
force weighing on the circumference of the ankle was measured. The experiment was performed by
the combination of 3-D motion capture (VICON512 OXFORD METRIX) and force platforms
(AMTI) and the SMO. This experiment system is shown in Fig. 1. The load-cell can measure the
force of ankle plantarflexion and ankle dorsiflexion in the circumference of an ankle during gait. The
signal from the force platforms of the VICON was time-synchronized with the load data taken in the
PC. Kinematical data were obtained from a set of a reflective marker sampling at 60 Hz placed on
the ankle joint of the orthosis. The subjects were patients with stroke with spastic paralysis as well as
healthy persons. Each subject was instructed to walk on the force platform.
SMO
Figure 1: The experiment system
Results
The situation of the load-cell attached to the back of the orthosis during walking is as follow. If the
ankle joint is plantarflexion, the load-cell measured the compressive loads (the negative loads). If the
ankle joint is dorsiflexion, the load-cell measured the tensile loads (the positive loads). In the
experiment, a normal gait and a spastic gait imitated by the healthy person were performed. The
spastic gait is to be imitated the paralysis of ankle plantarflexion due to strokes. Fig.2 shows the
measurement results for the normal gait, and for the spastic gait. The value of the vertical axis shows
the compressive load and the tensile load in the gait cycle. This graph shows two-gait cycles of the