
Page 281 - Methods For Monitoring And Diagnosing The Efficiency Of Catalytic Converters A Patent - oriented Survey
P. 281
Robert Bosch GmbH 263
Fig. 1 15 shows the variation of temperature Tcal of the activation region with time for a new, a
medium deteriorated and a fully deteriorated catalytic converter. During testing, the engine
idles and the catalytic converter is fully warmed-up. For t<to, T,,, is constant (=Ta,,,) and it is
the same for all three converters. From time point to till time point tl an airhe1 mixture is
added to the catalytic converter. The measured temperature variation from point to onwards
depends then on the condition of the catalytic converter. At time point to the increase of Tal is
steeper for new catalytic converters than for aged ones. Additionally the maximum temperature
observed in the activation region is higher for new catalytic converters than aged ones. That
means that the new catalytic converter converts higher quantities of aidfuel mixture in the
activation region, it releases higher heat energy and warms up the catalytic converter faster
than when the catalytic converter is aged. The slope of the curve i.e. the first or second
derivative of Tal and the difference of Tal from a reference temperature T,f can be a measure
of the efficiency of the activation region of the catalytic converter. At tl the addition of the
aidfuel mixture stops and the temperature of the three converters returns to value T,,, which
they had before heating them up.
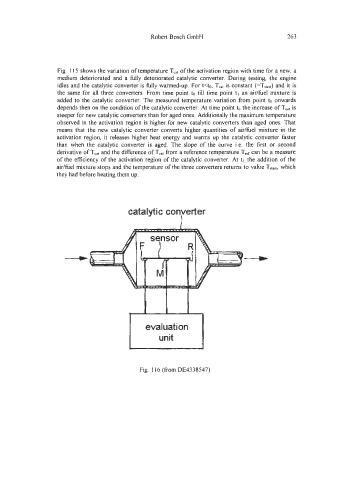
catalytic converter
I
evalua t i on
unit
Fig. 116 (from DE4338547)