
Page 221 - A Practical Guide from Design Planning to Manufacturing
P. 221
194 Chapter Six
Taken Tk = 1
State 3 PS = 11
Predict Prd = 1
taken
Taken Not taken Tk = 1 Tk = 0
State 2 PS = 10
Predict Prd = 1
taken
Taken Not taken Tk = 1 Tk = 0
State 1
Predict not PS = 01
Prd = 0
taken
Taken Not taken Tk = 1 Tk = 0
State 0
Predict not PS = 00
taken Prd = 0
Not taken Tk = 0
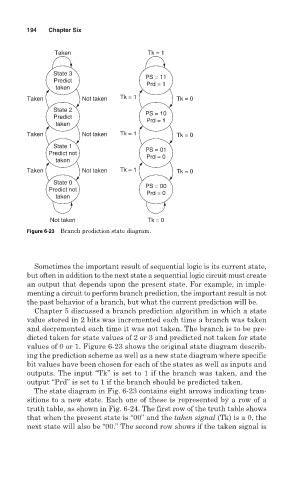
Figure 6-23 Branch prediction state diagram.
Sometimes the important result of sequential logic is its current state,
but often in addition to the next state a sequential logic circuit must create
an output that depends upon the present state. For example, in imple-
menting a circuit to perform branch prediction, the important result is not
the past behavior of a branch, but what the current prediction will be.
Chapter 5 discussed a branch prediction algorithm in which a state
value stored in 2 bits was incremented each time a branch was taken
and decremented each time it was not taken. The branch is to be pre-
dicted taken for state values of 2 or 3 and predicted not taken for state
values of 0 or 1. Figure 6-23 shows the original state diagram describ-
ing the prediction scheme as well as a new state diagram where specific
bit values have been chosen for each of the states as well as inputs and
outputs. The input “Tk” is set to 1 if the branch was taken, and the
output “Prd” is set to 1 if the branch should be predicted taken.
The state diagram in Fig. 6-23 contains eight arrows indicating tran-
sitions to a new state. Each one of these is represented by a row of a
truth table, as shown in Fig. 6-24. The first row of the truth table shows
that when the present state is “00” and the taken signal (Tk) is a 0, the
next state will also be “00.” The second row shows if the taken signal is