
Page 358 - Microsoft Office Excel 2003 Programming Inside Out
P. 358
Part 5: Manipulating Excel Objects
Microsoft Office Excel 2003 Programming Inside Out
When the names have been defined and the SERIES formula has been edited, your VBA code
can work with the names, and the changes will be reflected in the chart. For example, the fol
lowing statement redefines the range as Data:
Range(“B1:B12”).Name = “Data”
After executing the Name statement, the chart will update itself and use the new definition
of Data.
Now that you understand what the SERIES formula is responsible for, how do you modify it?
The easiest method is to redefine the chart data using the SetSourceData method of the Chart
object. However, you can manipulate individual series using the Series object. The Series
object is a member of the chart’s SeriesCollection object.
Inside Out
How the Chart SERIES Formula Works
The data used in each series in a chart is determined by its SERIES formula. When you
select a data series in a chart, the SERIES formula appears in the formula bar. The SERIES
formula is not a formula that you are able to enter into a worksheet as a traditional formula.
Basically, you can’t use it in a cell, nor can you use a function or formula within a SERIES
Chapter 15
formula. It’s possible, however, to edit the SERIES formula.
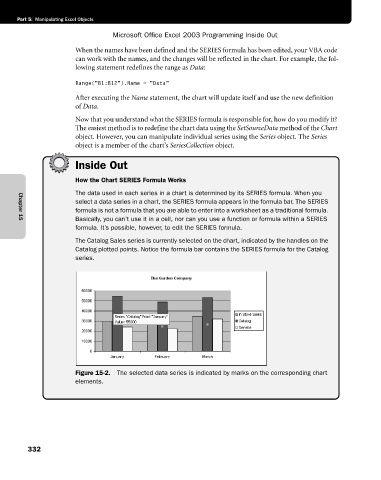
The Catalog Sales series is currently selected on the chart, indicated by the handles on the
Catalog plotted points. Notice the formula bar contains the SERIES formula for the Catalog
series.
F15pr02.eps
Figure 15-2. The selected data series is indicated by marks on the corresponding chart
elements.
332