Page 362 - Microsoft Office Excel 2003 Programming Inside Out
P. 362
Part 5: Manipulating Excel Objects
Microsoft Office Excel 2003 Programming Inside Out
For example, set up a line chart similar to Figure 15-4. Add the following macro to add the
chart labels that correspond to the top-selling products in row 4:
Sub AddDataLabels()
Dim seSales As Series
Dim Pts As Points
Dim pt As Point
Dim rng As Range
Dim i As Integer
Set rng = Range(“B4:G4”)
Set seSales = ActiveSheet.ChartObjects(1).Chart.SeriesCollection(1)
seSales.HasDataLabels = True
Set Pts = seSales.Points
For Each pt In Pts
i=i+1
pt.DataLabel.Text = “=“ & rng.Cells(i).Address(RowAbsolute:=True, _
ColumnAbsolute:=True, ReferenceStyle:=xlR1C1, External:=True)
pt.DataLabel.Font.Bold = True
pt.DataLabel.Position = xlLabelPositionCenter
Next pt
End Sub
The object variable rng is assigned a reference to B4:G4. The seSales series is assigned a refer
Chapter 15
ence to the first and only series in the embedded chart, and the HasDataLabels property of
the series is set to True. The For Each…Next loop processes each point in the data series.
For each point, the code assigns a formula to the Text property of the point’s data label. The
formula refers to the worksheet cell as an external reference in the R1C1 format. The data
label is also boldfaced, and the label positioned above the data point.
Formatting a Chart
Chart formatting is a broad category. You are able to format the ChartObject itself, as well as
all the objects contained within the chart. For example, you may modify the ChartObject
Location, such as changing an embedded chart to its own chart sheet. You may also classify
modifying the color selection for the data series as chart formatting. There are more than 60
chart properties available; Table 15-3 lists the commonly used Chart property names and the
results returned.
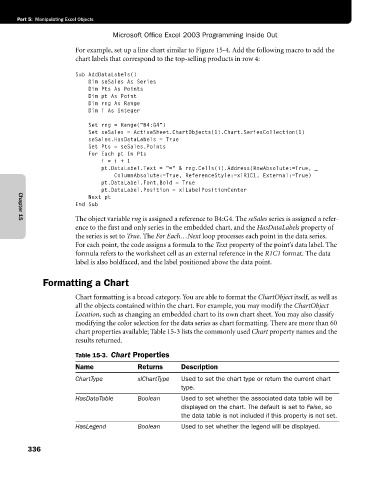
Table 15-3. Chart Properties
Name Returns Description
ChartType xlChartType Used to set the chart type or return the current chart
type.
HasDataTable Boolean Used to set whether the associated data table will be
displayed on the chart. The default is set to False, so
the data table is not included if this property is not set.
HasLegend Boolean Used to set whether the legend will be displayed.
336

