
Page 360 - Microsoft Office Excel 2003 Programming Inside Out
P. 360
Part 5: Manipulating Excel Objects
Microsoft Office Excel 2003 Programming Inside Out
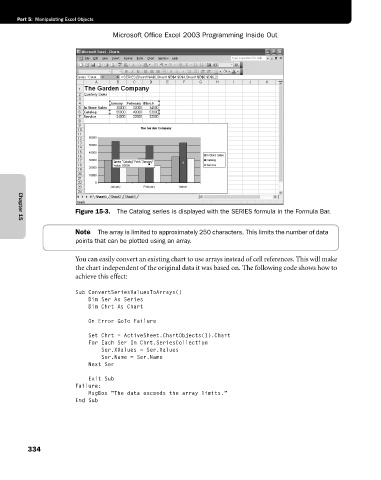
Figure 15-3. The Catalog series is displayed with the SERIES formula in the Formula Bar.
Chapter 15
Note The array is limited to approximately 250 characters. This limits the number of data
points that can be plotted using an array.
You can easily convert an existing chart to use arrays instead of cell references. This will make
the chart independent of the original data it was based on. The following code shows how to
achieve this effect:
Sub ConvertSeriesValuesToArrays()
Dim Ser As Series
Dim Chrt As Chart
On Error GoTo Failure
Set Chrt = ActiveSheet.ChartObjects(1).Chart
For Each Ser In Chrt.SeriesCollection
Ser.XValues = Ser.Values
Ser.Name = Ser.Name
Next Ser
Exit Sub
Failure:
MsgBox “The data exceeds the array limits."
End Sub
334