
Page 364 - Microsoft Office Excel 2003 Programming Inside Out
P. 364
Part 5: Manipulating Excel Objects
Microsoft Office Excel 2003 Programming Inside Out
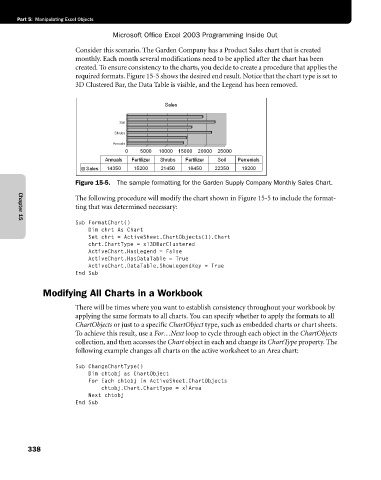
Consider this scenario. The Garden Company has a Product Sales chart that is created
monthly. Each month several modifications need to be applied after the chart has been
created. To ensure consistency to the charts, you decide to create a procedure that applies the
required formats. Figure 15-5 shows the desired end result. Notice that the chart type is set to
3D Clustered Bar, the Data Table is visible, and the Legend has been removed.
Figure 15-5. The sample formatting for the Garden Supply Company Monthly Sales Chart.
The following procedure will modify the chart shown in Figure 15-5 to include the format
ting that was determined necessary:
Sub FormatChart()
Chapter 15
Dim chrt As Chart
Set chrt = ActiveSheet.ChartObjects(1).Chart
chrt.ChartType = xl3DBarClustered
ActiveChart.HasLegend = False
ActiveChart.HasDataTable = True
ActiveChart.DataTable.ShowLegendKey = True
End Sub
Modifying All Charts in a Workbook
There will be times where you want to establish consistency throughout your workbook by
applying the same formats to all charts. You can specify whether to apply the formats to all
ChartObjects or just to a specific ChartObject type, such as embedded charts or chart sheets.
To achieve this result, use a For…Next loop to cycle through each object in the ChartObjects
collection, and then accesses the Chart object in each and change its ChartType property. The
following example changes all charts on the active worksheet to an Area chart:
Sub ChangeChartType()
Dim chtobj as ChartObject
For Each chtobj In ActiveSheet.ChartObjects
chtobj.Chart.ChartType = xlArea
Next chtobj
End Sub
338