
Page 369 - Microsoft Office Excel 2003 Programming Inside Out
P. 369
Part 5: Manipulating Excel Objects
PivotTables and PivotCharts
January 1 Fri 5 9 158
January 1 Sat 6 9 190
January 1 Sun 7 9 243
January 2 Mon 8 9 147
January 2 Tue 9 9 161
January 2 Wed 10 9 182
January 2 Thu 11 9 201
January 2 Fri 12 9 685
Excel uses individual transactions such as these to create the facts that are displayed in the
PivotTable. This process involves two steps: extracting the keys from the information in the
transactions and identifying the corresponding measure.
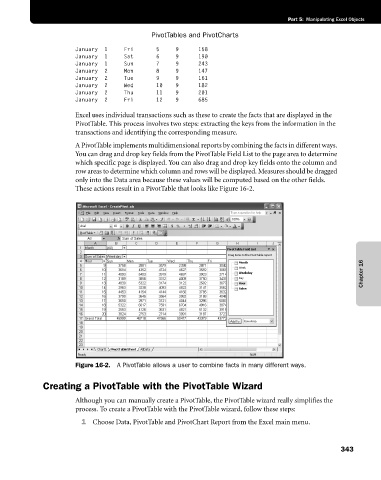
A PivotTable implements multidimensional reports by combining the facts in different ways.
You can drag and drop key fields from the PivotTable Field List to the page area to determine
which specific page is displayed. You can also drag and drop key fields onto the column and
row areas to determine which column and rows will be displayed. Measures should be dragged
only into the Data area because these values will be computed based on the other fields.
These actions result in a PivotTable that looks like Figure 16-2.
Chapter 16
Figure 16-2. A PivotTable allows a user to combine facts in many different ways.
Creating a PivotTable with the PivotTable Wizard
Although you can manually create a PivotTable, the PivotTable wizard really simplifies the
process. To create a PivotTable with the PivotTable wizard, follow these steps:
1 Choose Data, PivotTable and PivotChart Report from the Excel main menu.
343