Page 373 - Microsoft Office Excel 2003 Programming Inside Out
P. 373
Part 5: Manipulating Excel Objects
PivotTables and PivotCharts
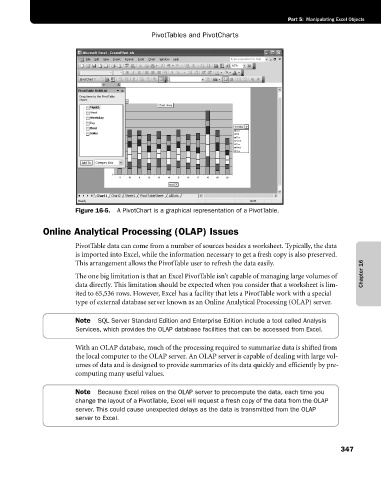
Figure 16-5. A PivotChart is a graphical representation of a PivotTable.
Online Analytical Processing (OLAP) Issues
PivotTable data can come from a number of sources besides a worksheet. Typically, the data
is imported into Excel, while the information necessary to get a fresh copy is also preserved.
This arrangement allows the PivotTable user to refresh the data easily.
The one big limitation is that an Excel PivotTable isn’t capable of managing large volumes of Chapter 16
data directly. This limitation should be expected when you consider that a worksheet is lim
ited to 65,536 rows. However, Excel has a facility that lets a PivotTable work with a special
type of external database server known as an Online Analytical Processing (OLAP) server.
Note SQL Server Standard Edition and Enterprise Edition include a tool called Analysis
Services, which provides the OLAP database facilities that can be accessed from Excel.
With an OLAP database, much of the processing required to summarize data is shifted from
the local computer to the OLAP server. An OLAP server is capable of dealing with large vol
umes of data and is designed to provide summaries of its data quickly and efficiently by pre-
computing many useful values.
Note Because Excel relies on the OLAP server to precompute the data, each time you
change the layout of a PivotTable, Excel will request a fresh copy of the data from the OLAP
server. This could cause unexpected delays as the data is transmitted from the OLAP
server to Excel.
347

