
Page 372 - Microsoft Office Excel 2003 Programming Inside Out
P. 372
Part 5: Manipulating Excel Objects
Microsoft Office Excel 2003 Programming Inside Out
Introducing PivotCharts
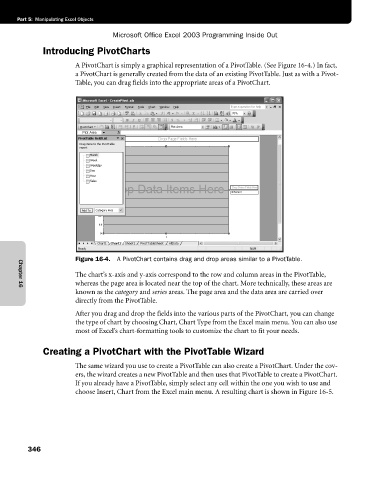
A PivotChart is simply a graphical representation of a PivotTable. (See Figure 16-4.) In fact,
a PivotChart is generally created from the data of an existing PivotTable. Just as with a Pivot-
Table, you can drag fields into the appropriate areas of a PivotChart.
Figure 16-4. A PivotChart contains drag and drop areas similar to a PivotTable.
The chart’s x-axis and y-axis correspond to the row and column areas in the PivotTable,
whereas the page area is located near the top of the chart. More technically, these areas are
known as the category and series areas. The page area and the data area are carried over
Chapter 16
directly from the PivotTable.
After you drag and drop the fields into the various parts of the PivotChart, you can change
the type of chart by choosing Chart, Chart Type from the Excel main menu. You can also use
most of Excel’s chart-formatting tools to customize the chart to fit your needs.
Creating a PivotChart with the PivotTable Wizard
The same wizard you use to create a PivotTable can also create a PivotChart. Under the cov
ers, the wizard creates a new PivotTable and then uses that PivotTable to create a PivotChart.
If you already have a PivotTable, simply select any cell within the one you wish to use and
choose Insert, Chart from the Excel main menu. A resulting chart is shown in Figure 16-5.
346