
Page 29 - Microtectonics
P. 29
16 2 · Flow and Deformation
sors (Box 2.3). It is therefore attractive to try and describe 1. Two lines exist along which stretching rate has its
natural flow and deformation as tensors. This is possible in maximum and minimum value, the instantaneous
many cases, since deviation of flow from homogeneity is stretching axes (ISA). They are orthogonal in any flow
scale-dependent (Fig. 2.4b); in any rock there are usually type (Figs. 2.5f, 2.6).
parts and scales that can be considered to approach homo- 2. If the stretching rate curve is symmetrically arranged
geneous flow behaviour for practical purposes (Fig. 2.4b). with respect to the zero stretching rate axis, no area
change is involved in the flow, and lines of zero stretch-
2.5.2 ing rate are orthogonal (Fig. 2.6); flow is isochoric. In
Numerical Description of Homogeneous Flow the case of area increase, all material lines are given
and Deformation an extra positive stretching rate and the curve is
shifted upwards; a deforming circle or square in-
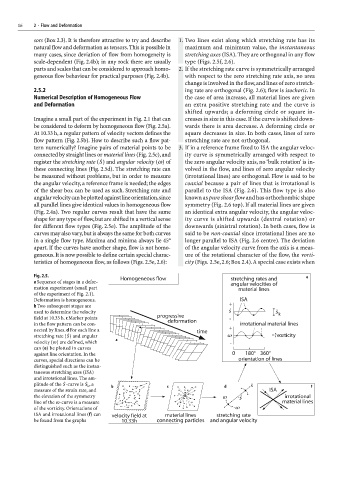
Imagine a small part of the experiment in Fig. 2.1 that can creases in size in this case. If the curve is shifted down-
be considered to deform by homogeneous flow (Fig. 2.5a). wards there is area decrease. A deforming circle or
At 10.33 h, a regular pattern of velocity vectors defines the square decreases in size. In both cases, lines of zero
flow pattern (Fig. 2.5b). How to describe such a flow pat- stretching rate are not orthogonal.
tern numerically? Imagine pairs of material points to be 3. If in a reference frame fixed to ISA the angular veloc-
connected by straight lines or material lines (Fig. 2.5c), and ity curve is symmetrically arranged with respect to
register the stretching rate (Ö) and angular velocity (ω) of the zero angular velocity axis, no ‘bulk rotation’ is in-
these connecting lines (Fig. 2.5d). The stretching rate can volved in the flow, and lines of zero angular velocity
be measured without problems, but in order to measure (irrotational lines) are orthogonal. Flow is said to be
the angular velocity, a reference frame is needed; the edges coaxial because a pair of lines that is irrotational is
of the shear box can be used as such. Stretching rate and parallel to the ISA (Fig. 2.6). This flow type is also
angular velocity can be plotted against line orientation, since known as pure shear flow and has orthorhombic shape
all parallel lines give identical values in homogeneous flow symmetry (Fig. 2.6 top). If all material lines are given
(Fig. 2.4a). Two regular curves result that have the same an identical extra angular velocity, the angular veloc-
shape for any type of flow, but are shifted in a vertical sense ity curve is shifted upwards (dextral rotation) or
for different flow types (Fig. 2.5e). The amplitude of the downwards (sinistral rotation). In both cases, flow is
curves may also vary, but is always the same for both curves said to be non-coaxial since irrotational lines are no
in a single flow type. Maxima and minima always lie 45° longer parallel to ISA (Fig. 2.6 centre). The deviation
apart. If the curves have another shape, flow is not homo- of the angular velocity curve from the axis is a meas-
geneous. It is now possible to define certain special charac- ure of the rotational character of the flow, the vorti-
teristics of homogeneous flow, as follows (Figs. 2.5e, 2.6): city (Figs. 2.5e, 2.6; Box 2.4). A special case exists when
Fig. 2.5.
a Sequence of stages in a defor-
mation experiment (small part
of the experiment of Fig. 2.1).
Deformation is homogeneous.
b Two subsequent stages are
used to determine the velocity
field at 10.33 h. c Marker points
in the flow pattern can be con-
nected by lines. d For each line a
stretching rate (Ö) and angular
velocity (ω) are defined, which
can (e) be plotted in curves
against line orientation. In the
curves, special directions can be
distinguished such as the instan-
taneous stretching axes (ISA)
and irrotational lines. The am-
plitude of the Ö-curve is Ö , a
k
measure of the strain rate, and
the elevation of the symmetry
line of the ω-curve is a measure
of the vorticity. Orientations of
ISA and irrotational lines (f) can
be found from the graphs