
Page 121 - MODELING OF ASPHALT CONCRETE
P. 121
Complex Modulus Characterization of Asphalt Concr ete 99
using dynamic stress levels of 138 to 965 kPa for colder temperatures of −9, 4.4, and
21.1°C. For warmer temperatures of 37.8 and 54.4°C, stress levels of 46–68 kPa and
about 21 kPa were used, respectively. For each temperature level, specimens were tested
in a decreasing order of frequency; frequencies used were 25, 10, 5, 1, 0.5, and 0.1 Hz. A
60-second rest period was used between each frequency to allow some specimen
recovery before applying new loading at lower frequency. This was done to reduce the
possible damage and heat accumulation during testing. This testing was conducted
trying to stay under 150 microstrains at all temperature and frequency levels.
For the confined testing program, the testing frame was equipped with a triaxial
cell capable of applying cell pressure up to 690 kPa. High-temperature stress levels
were determined based upon the stress to strength ratios determined using cohesion
and friction parameters from the triaxial strength test at 54.4°C. At colder temperatures,
the deviatoric stress was changed depending upon the stiffness of the mix. A 60-second
rest period was used between each frequency similar to the unconfined testing.
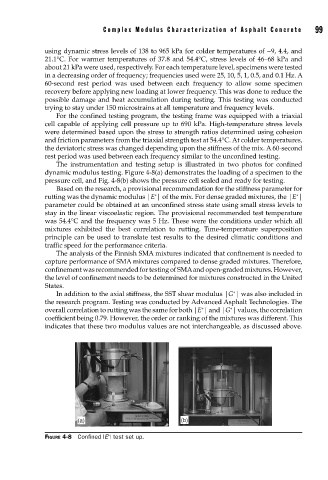
The instrumentation and testing setup is illustrated in two photos for confined
dynamic modulus testing. Figure 4-8(a) demonstrates the loading of a specimen to the
pressure cell, and Fig. 4-8(b) shows the pressure cell sealed and ready for testing.
Based on the research, a provisional recommendation for the stiffness parameter for
∗
∗
rutting was the dynamic modulus |E | of the mix. For dense graded mixtures, the |E |
parameter could be obtained at an unconfined stress state using small stress levels to
stay in the linear viscoelastic region. The provisional recommended test temperature
was 54.4°C and the frequency was 5 Hz. These were the conditions under which all
mixtures exhibited the best correlation to rutting. Time-temperature superposition
principle can be used to translate test results to the desired climatic conditions and
traffic speed for the performance criteria.
The analysis of the Finnish SMA mixtures indicated that confinement is needed to
capture performance of SMA mixtures compared to dense graded mixtures. Therefore,
confinement was recommended for testing of SMA and open-graded mixtures. However,
the level of confinement needs to be determined for mixtures constructed in the United
States.
∗
In addition to the axial stiffness, the SST shear modulus |G | was also included in
the research program. Testing was conducted by Advanced Asphalt Technologies. The
∗
∗
overall correlation to rutting was the same for both |E | and |G | values, the correlation
coefficient being 0.79. However, the order or ranking of the mixtures was different. This
indicates that these two modulus values are not interchangeable, as discussed above.
(a) (b)
∗
FIGURE 4-8 Confi ned |E | test set up.