
Page 121 - Modeling of Chemical Kinetics and Reactor Design
P. 121
Thermodynamics of Chemical Reactions 91
Table 2-3 gives the results of the program for the heats of reaction
at 298 K and 623 K, respectively
Example 2-4
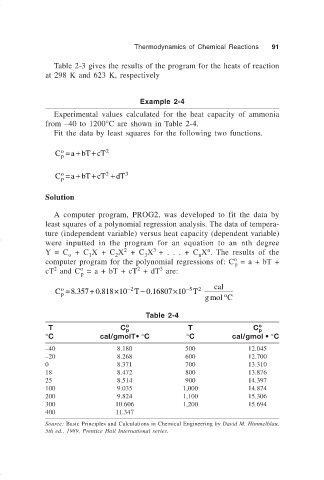
Experimental values calculated for the heat capacity of ammonia
from –40 to 1200°C are shown in Table 2-4.
Fit the data by least squares for the following two functions.
C =+ + 2
o
a bT cT
p
a bT cT +
C =+ + 2 dT 3
o
p
Solution
A computer program, PROG2, was developed to fit the data by
least squares of a polynomial regression analysis. The data of tempera-
ture (independent variable) versus heat capacity (dependent variable)
were inputted in the program for an equation to an nth degree
2
n
3
Y = C + C X + C X + C X + . . . + C X . The results of the
o 1 2 3 n
o
computer program for the polynomial regressions of: C = a + bT +
p
o
2
3
2
cT and C = a + bT + cT + dT are:
p
+
o
.
.
.
C =8 357 0 818 ×10 −2 T − 0 16807 ×10 −5 T 2 cal
p
o
gmol C
Table 2-4
T C o p T C o p
°C cal/gmolT• °C °C cal/gmol • °C
–40 8.180 500 12.045
–20 8.268 600 12.700
0 8.371 700 13.310
18 8.472 800 13.876
25 8.514 900 14.397
100 9.035 1,000 14.874
200 9.824 1,100 15.306
300 10.606 1,200 15.694
400 11.347
Source: Basic Principles and Calculations in Chemical Engineering by David M. Himmelblau,
5th ed., 1989, Prentice Hall International series.