
Page 201 - Modeling of Chemical Kinetics and Reactor Design
P. 201
Reaction Rate Expression 171
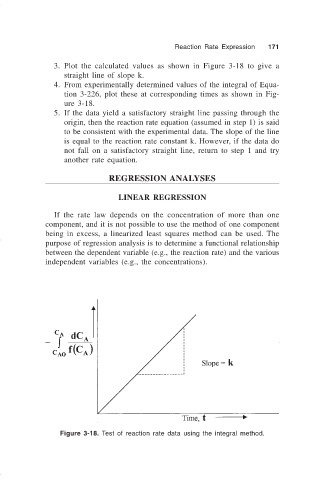
3. Plot the calculated values as shown in Figure 3-18 to give a
straight line of slope k.
4. From experimentally determined values of the integral of Equa-
tion 3-226, plot these at corresponding times as shown in Fig-
ure 3-18.
5. If the data yield a satisfactory straight line passing through the
origin, then the reaction rate equation (assumed in step 1) is said
to be consistent with the experimental data. The slope of the line
is equal to the reaction rate constant k. However, if the data do
not fall on a satisfactory straight line, return to step 1 and try
another rate equation.
REGRESSION ANALYSES
LINEAR REGRESSION
If the rate law depends on the concentration of more than one
component, and it is not possible to use the method of one component
being in excess, a linearized least squares method can be used. The
purpose of regression analysis is to determine a functional relationship
between the dependent variable (e.g., the reaction rate) and the various
independent variables (e.g., the concentrations).
Figure 3-18. Test of reaction rate data using the integral method.