
Page 170 - Modern Analytical Chemistry
P. 170
1400-CH06 9/9/99 7:40 AM Page 153
Chapter 6 Equilibrium Chemistry 153
6F.2 Ladder Diagrams for Complexation Equilibria
The same principles used in constructing and interpreting ladder diagrams for
acid–base equilibria can be applied to equilibria involving metal–ligand com-
plexes. For complexation reactions the ladder diagram’s scale is defined by the
concentration of uncomplexed, or free ligand, pL. Using the formation of
Cd(NH 3 ) 2+ as an example
2+
2+
Cd (aq)+NH 3 (aq) t Cd(NH 3 ) (aq)
we can easily show that the dividing line between the predominance regions for Cd 2+
2+
2+
Cd and Cd(NH 3 ) is log(K 1 ).
log K = 2.55
1
2 +
[Cd (NH 3 ) ]
K 1 =
[Cd 2 + ][NH 3 ] Cd(NH ) 2+
3
2 +
[Cd (NH 3 ) ] log K = 2.01
2
log( K 1 = log – log[NH 3 ]
)
[Cd 2 + ] 2+
3 2
p NH 3 Cd(NH )
2 +
[Cd (NH 3 ) ]
)
log( K 1 = log +pNH 3 log K = 1.34
3
[Cd 2 + ]
Cd(NH ) 2+
3 3
[Cd 2 + ]
pNH 3 = log( K 1 +log 2 + log K = 0.84
)
[Cd (NH 3 ) ] 4
Cd(NH ) 2+
3 4
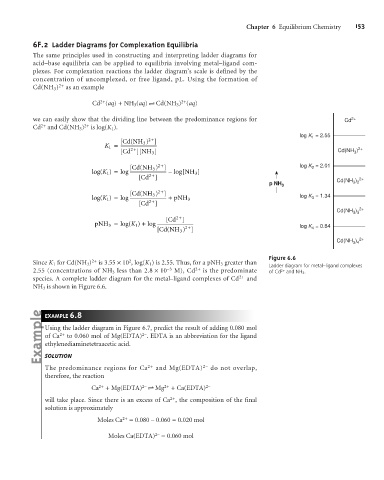
Figure 6.6
2
Since K 1 for Cd(NH 3 ) 2+ is 3.55 ´10 , log(K 1 ) is 2.55. Thus, for a pNH 3 greater than Ladder diagram for metal–ligand complexes
2.55 (concentrations of NH 3 less than 2.8 ´10 –3 M), Cd 2+ is the predominate of Cd 2+ and NH 3 .
species. A complete ladder diagram for the metal–ligand complexes of Cd 2+ and
NH 3 is shown in Figure 6.6.
EXAMPLE 6.8
Using the ladder diagram in Figure 6.7, predict the result of adding 0.080 mol
2–
of Ca 2+ to 0.060 mol of Mg(EDTA) . EDTA is an abbreviation for the ligand
ethylenediaminetetraacetic acid.
SOLUTION
The predominance regions for Ca 2+ and Mg(EDTA) 2– do not overlap,
therefore, the reaction
2–
Ca 2+ + Mg(EDTA) t Mg 2+ + Ca(EDTA) 2–
2+
will take place. Since there is an excess of Ca , the composition of the final
solution is approximately
Moles Ca 2+ = 0.080 – 0.060 = 0.020 mol
2–
Moles Ca(EDTA) = 0.060 mol