
Page 245 - Modern Analytical Chemistry
P. 245
1400-CH07 9/8/99 4:04 PM Page 228
228 Modern Analytical Chemistry
1.00 1.027 0.696 14. Determine the error (a= 0.05) for the following situations. In
0.987 0.843 each case, assume that the variance for a single determination
0.991 0.535 is 0.0025 and that the variance for collecting a single sample is
0.998 0.750 0.050. (a) Nine samples are collected, each of which is
analyzed once. (b) One sample is collected and analyzed nine
0.997 0.711
times. (c) Five samples are collected, each of which is analyzed
1.001 0.639
three times.
15. Which of the sampling schemes in problem 14 is best if you
2.50 2.496 0.766
wish to have an overall error of less than ±0.25, and the cost
2.504 0.769
of collecting a single sample is 1 (arbitrary units), and the cost
2.496 0.682
of analyzing a single sample is 10? Which is best if the cost of
2.496 0.609
collecting a single sample is 7, and the cost of analyzing a
2.557 0.589
single sample is 3?
2.509 0.617
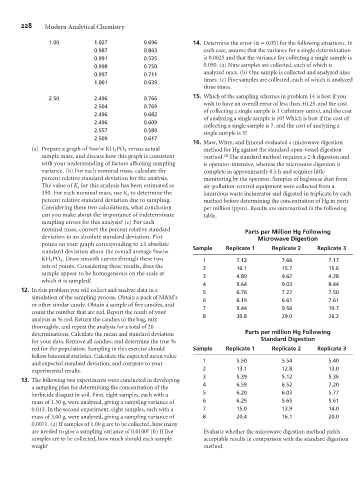
16. Maw, Witry, and Emond evaluated a microwave digestion
(a) Prepare a graph of %w/w KH 2 PO 4 versus actual method for Hg against the standard open-vessel digestion
sample mass, and discuss how this graph is consistent method. The standard method requires a 2-h digestion and
28
with your understanding of factors affecting sampling is operator-intensive, whereas the microwave digestion is
variance. (b) For each nominal mass, calculate the complete in approximately 0.5 h and requires little
percent relative standard deviation for the analysis. monitoring by the operator. Samples of baghouse dust from
The value of K s for this analysis has been estimated as air-pollution-control equipment were collected from a
350. For each nominal mass, use K s to determine the hazardous waste incinerator and digested in triplicate by each
percent relative standard deviation due to sampling. method before determining the concentration of Hg in parts
Considering these two calculations, what conclusion per million (ppm). Results are summarized in the following
can you make about the importance of indeterminate table.
sampling errors for this analysis? (c) For each
nominal mass, convert the percent relative standard
Parts per Million Hg Following
deviation to an absolute standard deviation. Plot
Microwave Digestion
points on your graph corresponding to ±1 absolute
Sample Replicate 1 Replicate 2 Replicate 3
standard deviation about the overall average %w/w
KH 2 PO 4 . Draw smooth curves through these two 1 7.12 7.66 7.17
sets of points. Considering these results, does the
2 16.1 15.7 15.6
sample appear to be homogeneous on the scale at
3 4.89 4.62 4.28
which it is sampled?
4 9.64 9.03 8.44
12. In this problem you will collect and analyze data in a
5 6.76 7.22 7.50
simulation of the sampling process. Obtain a pack of M&M’s
6 6.19 6.61 7.61
or other similar candy. Obtain a sample of five candies, and
7 9.44 9.56 10.7
count the number that are red. Report the result of your
8 30.8 29.0 26.2
analysis as % red. Return the candies to the bag, mix
thoroughly, and repeat the analysis for a total of 20
determinations. Calculate the mean and standard deviation Parts per million Hg Following
Standard Digestion
for your data. Remove all candies, and determine the true %
red for the population. Sampling in this exercise should Sample Replicate 1 Replicate 2 Replicate 3
follow binomial statistics. Calculate the expected mean value
1 5.50 5.54 5.40
and expected standard deviation, and compare to your
experimental results. 2 13.1 12.8 13.0
3 5.39 5.12 5.36
13. The following two experiments were conducted in developing
4 6.59 6.52 7.20
a sampling plan for determining the concentration of the
herbicide diaquat in soil. First, eight samples, each with a 5 6.20 6.03 5.77
mass of 1.50 g, were analyzed, giving a sampling variance of 6 6.25 5.65 5.61
0.013. In the second experiment, eight samples, each with a 7 15.0 13.9 14.0
mass of 3.00 g, were analyzed, giving a sampling variance of 8 20.4 16.1 20.0
0.0071. (a) If samples of 1.00 g are to be collected, how many
are needed to give a sampling variance of 0.0100? (b) If five Evaluate whether the microwave digestion method yields
samples are to be collected, how much should each sample acceptable results in comparison with the standard digestion
weigh? method.