
Page 240 - Modern Analytical Chemistry
P. 240
1400-CH07 9/8/99 4:04 PM Page 223
Chapter 7 Obtaining and Preparing Samples for Analysis 223
(c)
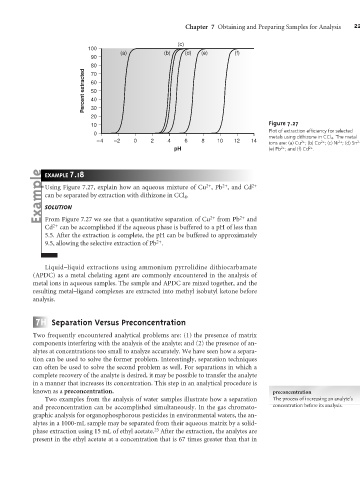
100
(a) (b) (d) (e) (f)
90
80
Percent extracted 60
70
50
40
30
20
Figure 7.27
10
Plot of extraction efficiency for selected
0
metals using dithizone in CCl 4 . The metal
–4 –2 0 2 4 6 8 10 12 14 2+ 2+ 2+ 2+
ions are: (a) Cu ; (b) Co ; (c) Ni ; (d) Sn ;
2+
2+
pH (e) Pb ; and (f) Cd .
7
EXAMPLE .18
2+
2+
Using Figure 7.27, explain how an aqueous mixture of Cu , Pb , and Cd 2+
can be separated by extraction with dithizone in CCl 4 .
SOLUTION
From Figure 7.27 we see that a quantitative separation of Cu 2+ from Pb 2+ and
Cd 2+ can be accomplished if the aqueous phase is buffered to a pH of less than
5.5. After the extraction is complete, the pH can be buffered to approximately
2+
9.5, allowing the selective extraction of Pb .
Liquid–liquid extractions using ammonium pyrrolidine dithiocarbamate
(APDC) as a metal chelating agent are commonly encountered in the analysis of
metal ions in aqueous samples. The sample and APDC are mixed together, and the
resulting metal–ligand complexes are extracted into methyl isobutyl ketone before
analysis.
7 H Separation Versus Preconcentration
Two frequently encountered analytical problems are: (1) the presence of matrix
components interfering with the analysis of the analyte; and (2) the presence of an-
alytes at concentrations too small to analyze accurately. We have seen how a separa-
tion can be used to solve the former problem. Interestingly, separation techniques
can often be used to solve the second problem as well. For separations in which a
complete recovery of the analyte is desired, it may be possible to transfer the analyte
in a manner that increases its concentration. This step in an analytical procedure is
known as a preconcentration. preconcentration
Two examples from the analysis of water samples illustrate how a separation The process of increasing an analyte’s
and preconcentration can be accomplished simultaneously. In the gas chromato- concentration before its analysis.
graphic analysis for organophosphorous pesticides in environmental waters, the an-
alytes in a 1000-mL sample may be separated from their aqueous matrix by a solid-
23
phase extraction using 15 mL of ethyl acetate. After the extraction, the analytes are
present in the ethyl acetate at a concentration that is 67 times greater than that in