
Page 238 - Modern Analytical Chemistry
P. 238
1400-CH07 9/8/99 4:04 PM Page 221
Chapter 7 Obtaining and Preparing Samples for Analysis 221
The fraction of solute remaining in the aqueous phase is 80.00
50 .00 mL 70.00
(Q aq 1 = = . 0 252
)
(2.97)(50.00 mL ) + 50 .00 mL 60.00
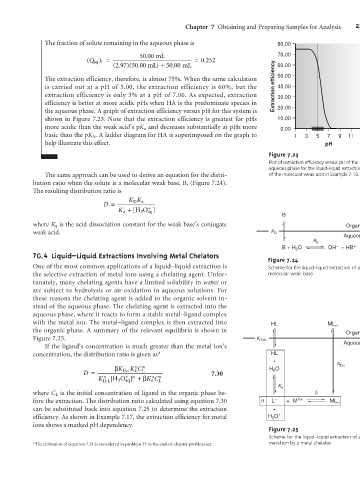
The extraction efficiency, therefore, is almost 75%. When the same calculation 50.00
is carried out at a pH of 5.00, the extraction efficiency is 60%, but the Extraction efficiency 40.00
extraction efficiency is only 3% at a pH of 7.00. As expected, extraction 30.00
efficiency is better at more acidic pHs when HA is the predominate species in
the aqueous phase. A graph of extraction efficiency versus pH for this system is 20.00
shown in Figure 7.23. Note that the extraction efficiency is greatest for pHs 10.00
more acidic than the weak acid’s pK a and decreases substantially at pHs more 0.00
basic than the pK A . A ladder diagram for HA is superimposed on the graph to 1 3 5 7 9 11 13
help illustrate this effect. pH
Figure 7.23
Plot of extraction efficiency versus pH of the
aqueous phase for the liquid–liquid extraction
The same approach can be used to derive an equation for the distri- of the molecular weak acid in Example 7.16.
bution ratio when the solute is a molecular weak base, B, (Figure 7.24).
The resulting distribution ratio is
KK a
D
D =
K + HO[ 3 + aq ]
a
B
where K a is the acid dissociation constant for the weak base’s conjugate Organic
weak acid. K D
Aqueous
K b
–
B + H O OH + HB +
2
7 4
G. Liquid–Liquid Extractions Involving Metal Chelators
Figure 7.24
One of the most common applications of a liquid–liquid extraction is Scheme for the liquid–liquid extraction of a
the selective extraction of metal ions using a chelating agent. Unfor- molecular weak base.
tunately, many chelating agents have a limited solubility in water or
are subject to hydrolysis or air oxidation in aqueous solutions. For
these reasons the chelating agent is added to the organic solvent in-
stead of the aqueous phase. The chelating agent is extracted into the
aqueous phase, where it reacts to form a stable metal–ligand complex
with the metal ion. The metal–ligand complex is then extracted into HL ML n
the organic phase. A summary of the relevant equilibria is shown in
Organic
Figure 7.25. K D,HL
Aqueous
If the ligand’s concentration is much greater than the metal ion’s
concentration, the distribution ratio is given as* HL
+
n
b K D,c K C n L H O K D,c
a
2
D = 7.30
n
K C
K D,L [ HO + aq ] n +b a n L n
3
K a
where C L is the initial concentration of ligand in the organic phase be- b
fore the extraction. The distribution ratio calculated using equation 7.30 n L – + M n+ ML n
can be substituted back into equation 7.25 to determine the extraction +
efficiency. As shown in Example 7.17, the extraction efficiency for metal H 3 O +
ions shows a marked pH dependency.
Figure 7.25
Scheme for the liquid–liquid extraction of a
*The derivation of equation 7.31 is considered in problem 33 in the end-of-chapter problem set. metal ion by a metal chelator.