
Page 348 - Modern Analytical Chemistry
P. 348
1400-CH09 9/9/99 2:13 PM Page 331
Chapter 9 Titrimetric Methods of Analysis 331
0.08946 g ´5 = 0.4473 g Ni
0.03025 g ´5 = 0.1513 g Fe
0.02378 g ´5 = 0.1189 g Cr
and the %w/w for each metal is
.
0 4473 g
´ 100 = 62 33.% w/w Ni
0.7176 g
0 1513 g 10 (a)
.
´ 100 = 21 08.% w/w Fe
0.7176 g 9
8
7
0 1189 g 6
.
´ 100 = 16 57.% w/w Cr pCa 5
.
0 7176 g 4 (b)
3
2
1
0
0.0 20.0 40.0 60.0 80.0 100.0
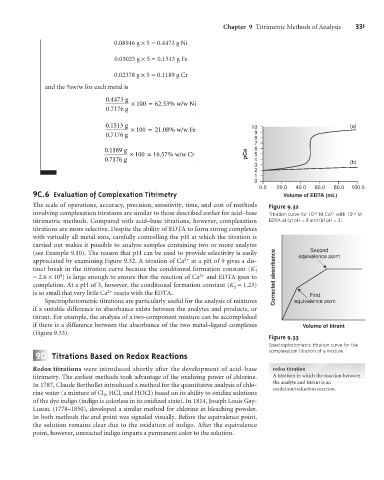
9 C.6 Evaluation of Complexation Titrimetry Volume of EDTA (mL)
The scale of operations, accuracy, precision, sensitivity, time, and cost of methods Figure 9.32
involving complexation titrations are similar to those described earlier for acid–base Titration curve for 10 –2 M Ca 2+ with 10 –2 M
titrimetric methods. Compared with acid–base titrations, however, complexation EDTA at (a) pH = 9 and (b) pH = 3.
titrations are more selective. Despite the ability of EDTA to form strong complexes
with virtually all metal ions, carefully controlling the pH at which the titration is
carried out makes it possible to analyze samples containing two or more analytes
Second
(see Example 9.10). The reason that pH can be used to provide selectivity is easily equivalence point
appreciated by examining Figure 9.32. A titration of Ca 2+ at a pH of 9 gives a dis-
tinct break in the titration curve because the conditional formation constant (K´
f
9
= 2.6 ´10 ) is large enough to ensure that the reaction of Ca 2+ and EDTA goes to Corrected absorbance
completion. At a pH of 3, however, the conditional formation constant (K´ = 1.23)
f
2+
is so small that very little Ca reacts with the EDTA. First
Spectrophotometric titrations are particularly useful for the analysis of mixtures equivalence point
if a suitable difference in absorbance exists between the analytes and products, or
titrant. For example, the analysis of a two-component mixture can be accomplished
if there is a difference between the absorbance of the two metal–ligand complexes Volume of titrant
(Figure 9.33).
Figure 9.33
Spectrophotometric titration curve for the
9 D Titrations Based on Redox Reactions complexation titration of a mixture.
Redox titrations were introduced shortly after the development of acid–base redox titration
titrimetry. The earliest methods took advantage of the oxidizing power of chlorine. A titration in which the reaction between
the analyte and titrant is an
In 1787, Claude Berthollet introduced a method for the quantitative analysis of chlo-
oxidation/reduction reaction.
rine water (a mixture of Cl 2 , HCl, and HOCl) based on its ability to oxidize solutions
of the dye indigo (indigo is colorless in its oxidized state). In 1814, Joseph Louis Gay-
Lussac (1778–1850), developed a similar method for chlorine in bleaching powder.
In both methods the end point was signaled visually. Before the equivalence point,
the solution remains clear due to the oxidation of indigo. After the equivalence
point, however, unreacted indigo imparts a permanent color to the solution.