Page 343 - Modern Analytical Chemistry
P. 343

1400-CH09  9/9/99  2:13 PM  Page 326


              326    Modern Analytical Chemistry  Method 9.2 Determination of Hardness of Water and Wastewater 12


                                              Representative Methods  Description of the Method.  The operational definition of water hardness is the


                                                total concentration of cations in a sample capable of forming insoluble complexes
                                                with soap. Although most divalent and trivalent metal ions contribute to hardness,
                                                                    2+
                                                                           2+
                                                                     and Mg . Hardness is determined by titrating with
                                                the most important are Ca
                                                EDTA at a buffered pH of 10. Eriochrome Black T or calmagite is used as a visual
                                                indicator. Hardness is reported in parts per million CaCO 3 .
              The photo in Colorplate 8b shows the
              indicator’s color change for this titration.  Procedure.  Select a volume of sample requiring less than 15 mL of titrant to keep
                                                the analysis time under 5 min and, if necessary, dilute the sample to 50 mL with
                                                distilled water. Adjust the pH by adding 1–2 mL of a pH 10 buffer containing a small
                                                           2+
                                                amount of Mg –EDTA. Add 1–2 drops of indicator, and titrate with a standard
                                                solution of EDTA until the red-to-blue end point is reached.
                                                Questions
                                                 1. Why is the sample buffered to a pH of 10? What problems might be expected
                                                   at higher or lower pHs?
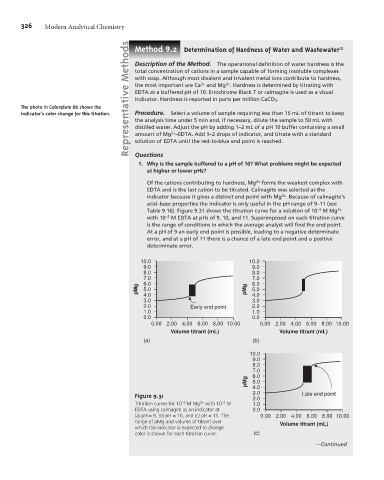
                                                   Of the cations contributing to hardness, Mg 2+  forms the weakest complex with
                                                   EDTA and is the last cation to be titrated. Calmagite was selected as the
                                                                                            2+
                                                   indicator because it gives a distinct end point with Mg . Because of calmagite’s
                                                   acid–base properties the indicator is only useful in the pH range of 9–11 (see
                                                   Table 9.16). Figure 9.31 shows the titration curve for a solution of 10 –3  M Mg 2+
                                                   with 10 –2  M EDTA at pHs of 9, 10, and 11. Superimposed on each titration curve
                                                   is the range of conditions in which the average analyst will find the end point.
                                                   At a pH of 9 an early end point is possible, leading to a negative determinate
                                                   error, and at a pH of 11 there is a chance of a late end point and a positive
                                                   determinate error.

                                                 10.0                             10.0
                                                  9.0                              9.0
                                                  8.0                              8.0
                                                  7.0                              7.0
                                                 pMg  6.0                        pMg  6.0
                                                  5.0
                                                                                   5.0
                                                  4.0
                                                                                   3.0
                                                  3.0                              4.0
                                                  2.0           Early end point    2.0
                                                  1.0                              1.0
                                                  0.0                              0.0
                                                     0.00 2.00 4.00 6.00 8.00  10.00  0.00 2.00 4.00 6.00 8.00  10.00
                                                           Volume titrant (mL)             Volume titrant (mL)
                                                  (a)                              (b)
                                                                                  10.0
                                                                                   9.0
                                                                                   8.0
                                                                                   7.0
                                                                                   6.0
                                                                                 pMg  5.0
                                                                                   4.0
                                                Figure 9.31                        3.0            Late end point
                                                                                   2.0
                                                Titration curves for 10 –3  M Mg 2+  with 10 –2  M  1.0
                                                EDTA using calmagite as an indicator at  0.0
                                                (a) pH = 9, (b) pH = 10, and (c) pH = 11. The  0.00 2.00 4.00 6.00 8.00  10.00
                                                range of pMg and volume of titrant over    Volume titrant (mL)
                                                which the indicator is expected to change
                                                color is shown for each titration curve.  (c)
                                                                                                      —Continued
   338   339   340   341   342   343   344   345   346   347   348