Page 339 - Modern Analytical Chemistry
P. 339

1400-CH09  9/9/99  2:13 PM  Page 322


              322    Modern Analytical Chemistry


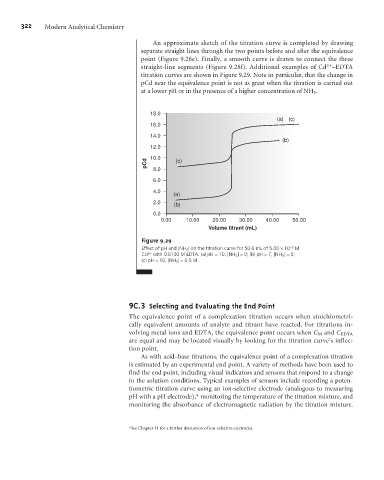
                                                     An approximate sketch of the titration curve is completed by drawing
                                                  separate straight lines through the two points before and after the equivalence
                                                  point (Figure 9.28e). Finally, a smooth curve is drawn to connect the three
                                                                                                         2+
                                                  straight-line segments (Figure 9.28f). Additional examples of Cd –EDTA
                                                  titration curves are shown in Figure 9.29. Note in particular, that the change in
                                                  pCd near the equivalence point is not as great when the titration is carried out
                                                  at a lower pH or in the presence of a higher concentration of NH 3 .


                                                    18.0
                                                                                          (a)  (c)
                                                    16.0
                                                    14.0
                                                                                            (b)
                                                    12.0
                                                    10.0
                                                   pCd  8.0  (c)


                                                     6.0
                                                     4.0
                                                           (a)
                                                     2.0    (b)
                                                     0.0
                                                        0.00   10.00   20.00   30.00   40.00   50.00
                                                                      Volume titrant (mL)

                                                  Figure 9.29
                                                  Effect of pH and [NH 3 ] on the titration curve for 50.0 mL of 5.00 ´10 –3  M
                                                  Cd 2+  with 0.0100 M EDTA. (a) pH = 10, [NH 3 ] = 0; (b) pH = 7, [NH 3 ]=0;
                                                  (c) pH = 10, [NH 3 ] = 0.5 M.


                                              9 3   Selecting and Evaluating the End Point
                                               C.
                                              The equivalence point of a complexation titration occurs when stoichiometri-
                                              cally equivalent amounts of analyte and titrant have reacted. For titrations in-
                                              volving metal ions and EDTA, the equivalence point occurs when C M and C EDTA
                                              are equal and may be located visually by looking for the titration curve’s inflec-
                                              tion point.
                                                  As with acid–base titrations, the equivalence point of a complexation titration
                                              is estimated by an experimental end point. A variety of methods have been used to
                                              find the end point, including visual indicators and sensors that respond to a change
                                              in the solution conditions. Typical examples of sensors include recording a poten-
                                              tiometric titration curve using an ion-selective electrode (analogous to measuring
                                              pH with a pH electrode),* monitoring the temperature of the titration mixture, and
                                              monitoring the absorbance of electromagnetic radiation by the titration mixture.


                                              *See Chapter 11 for a further discussion of ion-selective electrodes.
   334   335   336   337   338   339   340   341   342   343   344