
Page 337 - Modern Analytical Chemistry
P. 337
1400-CH09 9/9/99 2:13 PM Page 320
320 Modern Analytical Chemistry
9 5
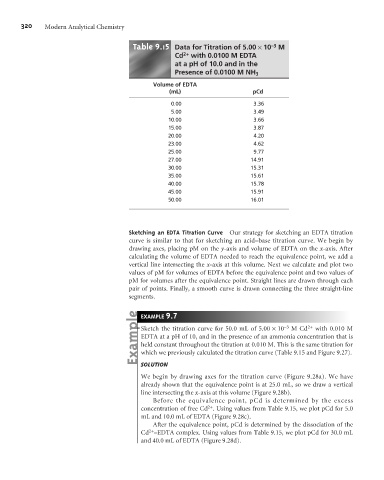
Table .1 Data for Titration of 5.00 ´10 –3 M
Cd 2+ with 0.0100 M EDTA
at a pH of 10.0 and in the
Presence of 0.0100 M NH 3
Volume of EDTA
(mL) pCd
0.00 3.36
5.00 3.49
10.00 3.66
15.00 3.87
20.00 4.20
23.00 4.62
25.00 9.77
27.00 14.91
30.00 15.31
35.00 15.61
40.00 15.78
45.00 15.91
50.00 16.01
Sketching an EDTA Titration Curve Our strategy for sketching an EDTA titration
curve is similar to that for sketching an acid–base titration curve. We begin by
drawing axes, placing pM on the y-axis and volume of EDTA on the x-axis. After
calculating the volume of EDTA needed to reach the equivalence point, we add a
vertical line intersecting the x-axis at this volume. Next we calculate and plot two
values of pM for volumes of EDTA before the equivalence point and two values of
pM for volumes after the equivalence point. Straight lines are drawn through each
pair of points. Finally, a smooth curve is drawn connecting the three straight-line
segments.
9 7
EXAMPLE .
Sketch the titration curve for 50.0 mL of 5.00 ´10 –3 M Cd 2+ with 0.010 M
EDTA at a pH of 10, and in the presence of an ammonia concentration that is
held constant throughout the titration at 0.010 M. This is the same titration for
which we previously calculated the titration curve (Table 9.15 and Figure 9.27).
SOLUTION
We begin by drawing axes for the titration curve (Figure 9.28a). We have
already shown that the equivalence point is at 25.0 mL, so we draw a vertical
line intersecting the x-axis at this volume (Figure 9.28b).
Before the equivalence point, pCd is determined by the excess
2+
concentration of free Cd . Using values from Table 9.15, we plot pCd for 5.0
mL and 10.0 mL of EDTA (Figure 9.28c).
After the equivalence point, pCd is determined by the dissociation of the
2+
Cd –EDTA complex. Using values from Table 9.15, we plot pCd for 30.0 mL
and 40.0 mL of EDTA (Figure 9.28d).