
Page 334 - Modern Analytical Chemistry
P. 334
1400-CH09 9/9/99 2:13 PM Page 317
Chapter 9 Titrimetric Methods of Analysis 317
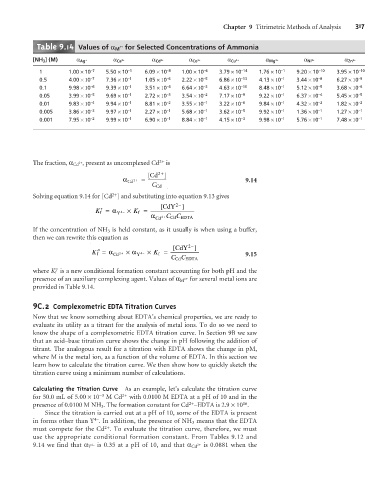
Table 9.14 Values of a M for Selected Concentrations of Ammonia
n+
[NH 3 ] (M) a Ag + a Ca 2+ a Cd 2+ a Co 2+ a Cu 2+ a Mg 2+ a Ni 2+ a Zn 2+
1 1.00 ´ 10 –7 5.50 ´ 10 –1 6.09 ´ 10 –8 1.00 ´ 10 –6 3.79 ´ 10 –14 1.76 ´ 10 –1 9.20 ´ 10 –10 3.95 ´ 10 –10
0
0.5 4.00 ´ 1 –7 7.36 ´ 1 –1 1.05 ´ 1 –6 2.22 ´ 1 –5 6.86 ´ 1 –13 4.13 ´ 1 –1 3.44 ´ 1 –8 6.27 ´ 1 –9
0
0
0
0
0
0
0
0
0
0
0.1 9.98 ´ 1 –6 9.39 ´ 1 –1 3.51 ´ 1 –4 6.64 ´ 1 –3 4.63 ´ 1 –10 8.48 ´ 1 –1 5.12 ´ 1 –5 3.68 ´ 1 –6
0
0
0
0
0
0.05 3.99 ´ 1 –5 9.69 ´ 1 –1 2.72 ´ 1 –3 3.54 ´ 1 –2 7.17 ´ 1 –9 9.22 ´ 1 –1 6.37 ´ 1 –4 5.45 ´ 1 –5
0
0
0
0
0
0
0
0
0
0
0
0
0
0
0
0.01 9.83 ´ 1 –4 9.94 ´ 1 –1 8.81 ´ 1 –2 3.55 ´ 1 –1 3.22 ´ 1 –6 9.84 ´ 1 –1 4.32 ´ 1 –2 1.82 ´ 1 –2
0
0
0
0
0
0
0
0
0.005 3.86 ´ 1 –3 9.97 ´ 1 –1 2.27 ´ 1 –1 5.68 ´ 1 –1 3.62 ´ 1 –5 9.92 ´ 1 –1 1.36 ´ 1 –1 1.27 ´ 1 –1
0
0
0
0
0.001 7.95 ´ 1 –2 9.99 ´ 1 –1 6.90 ´ 1 –1 8.84 ´ 1 –1 4.15 ´ 1 –3 9.98 ´ 1 –1 5.76 ´ 1 –1 7.48 ´ 1 –1
0
0
0
0
0
2+
The fraction, a Cd , present as uncomplexed Cd is
2+
2 +
[ Cd ]
a Cd 2+ = 9.14
C Cd
2+
Solving equation 9.14 for [Cd ] and substituting into equation 9.13 gives
[ CdY 2 - ]
¢= a =
K f 4 - ´K f
Y
a Cd 2 +CC EDTA
Cd
If the concentration of NH 3 is held constant, as it usually is when using a buffer,
then we can rewrite this equation as
[ CdY 2 - ]
¢¢ = a =
K f 2 + ´a 4 - ´K f
Cd Y 9.15
CC EDTA
Cd
where K f ˝ is a new conditional formation constant accounting for both pH and the
presence of an auxiliary complexing agent. Values of a M for several metal ions are
n+
provided in Table 9.14.
9 C.2 Complexometric EDTA Titration Curves
Now that we know something about EDTA’s chemical properties, we are ready to
evaluate its utility as a titrant for the analysis of metal ions. To do so we need to
know the shape of a complexometric EDTA titration curve. In Section 9B we saw
that an acid–base titration curve shows the change in pH following the addition of
titrant. The analogous result for a titration with EDTA shows the change in pM,
where M is the metal ion, as a function of the volume of EDTA. In this section we
learn how to calculate the titration curve. We then show how to quickly sketch the
titration curve using a minimum number of calculations.
Calculating the Titration Curve As an example, let’s calculate the titration curve
for 50.0 mL of 5.00 ´10 –3 M Cd 2+ with 0.0100 M EDTA at a pH of 10 and in the
2+
16
presence of 0.0100 M NH 3 . The formation constant for Cd –EDTA is 2.9 ´10 .
Since the titration is carried out at a pH of 10, some of the EDTA is present
4–
in forms other than Y . In addition, the presence of NH 3 means that the EDTA
2+
must compete for the Cd . To evaluate the titration curve, therefore, we must
use the appropriate conditional formation constant. From Tables 9.12 and
9.14 we find that a Y is 0.35 at a pH of 10, and that a Cd is 0.0881 when the
4–
2+