
Page 121 - Modern Control of DC-Based Power Systems
P. 121
Background 85
in a logarithmic scale. Using a log-magnitude plot, it is possible to con-
vert the multiplication of the factors of the GjωðÞHjωðÞ into addition and
use a simple method for sketching the log-magnitude diagrams. Thus,
knowing the contribution of basic factors that can appear in an arbitrary
open-loop transfer function, one can readily sketch the overall log-
magnitude diagram of the system as the addition of the individual curves
corresponding to each of the factors.
The main factors that appear in an arbitrary open-loop transfer func-
tion are as follows:
• Constant gain K
• Integral and derivate factors
• First-order factors
• Second-order or quadratic factors
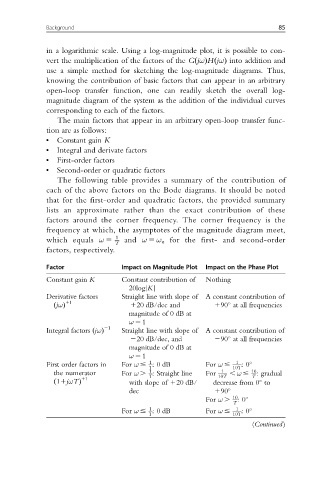
The following table provides a summary of the contribution of
each of the above factors on the Bode diagrams. It should be noted
that for the first-order and quadratic factors, the provided summary
lists an approximate rather than the exact contribution of these
factors around the corner frequency. The corner frequency is the
frequency at which, the asymptotes of the magnitude diagram meet,
which equals ω 5 1 and ω 5 ω n for the first- and second-order
T
factors, respectively.
Factor Impact on Magnitude Plot Impact on the Phase Plot
Constant gain K Constant contribution of Nothing
20log K jj
Derivative factors Straight line with slope of A constant contribution of
jω 11 120 dB/dec and 190 at all frequencies
ðÞ
magnitude of 0 dB at
ω 5 1
21
Integral factors jωðÞ Straight line with slope of A constant contribution of
220 dB/dec, and 290 at all frequencies
magnitude of 0 dB at
ω 5 1
1
First order factors in For ω # : 0 dB For ω # 1 :0
T 10T
1
the numerator For ω . : Straight line For 1 , ω # 10 : gradual
11 T 10T T
with slope of 120 dB/ decrease from 0 to
ð 11jωTÞ
dec 190
For ω . 10 :0
T
1
For ω # : 0 dB For ω # 1 :0
T 10T
(Continued)