
Page 123 - Modern Control of DC-Based Power Systems
P. 123
Background 87
For a nonminimum phase system to be stable, it is necessary that both
PM and GM are positive. Thus, knowledge of positive PM or positive
GM alone cannot be used to confirm the stability of a nonminimum-
phase system.
As a rule of thumb, for a PM between 30 and 60 degrees and a GM
larger than 6 dB, a nonminimum-phase system is not only stable but has
also satisfactory behavior even in spite of reasonable variations in system
parameters [1].
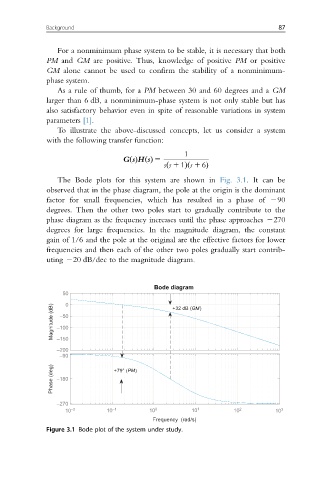
To illustrate the above-discussed concepts, let us consider a system
with the following transfer function:
1
GsðÞHðsÞ 5
sðs 1 1Þðs 1 6Þ
The Bode plots for this system are shown in Fig. 3.1. It can be
observed that in the phase diagram, the pole at the origin is the dominant
factor for small frequencies, which has resulted in a phase of 290
degrees. Then the other two poles start to gradually contribute to the
phase diagram as the frequency increases until the phase approaches 2270
degrees for large frequencies. In the magnitude diagram, the constant
gain of 1/6 and the pole at the original are the effective factors for lower
frequencies and then each of the other two poles gradually start contrib-
uting 220 dB/dec to the magnitude diagram.
Bode diagram
50
0
GM
–50
–100
–150
–200
–90
PM
–180
–270
10 –2 10 –1 10 0 10 1 10 2 10 3
Figure 3.1 Bode plot of the system under study.