
Page 129 - MODERN ELECTROCHEMISTRY
P. 129
ION–SOLVENT INTERACTIONS 69
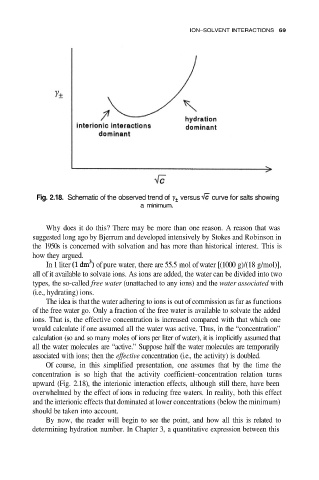
Fig. 2.18. Schematic of the observed trend of versus curve for salts showing
a minimum.
Why does it do this? There may be more than one reason. A reason that was
suggested long ago by Bjerrum and developed intensively by Stokes and Robinson in
the 1950s is concerned with solvation and has more than historical interest. This is
how they argued.
In 1 liter of pure water, there are 55.5 mol of water [(1000 g)/(18 g/mol)],
all of it available to solvate ions. As ions are added, the water can be divided into two
types, the so-called free water (unattached to any ions) and the water associated with
(i.e., hydrating) ions.
The idea is that the water adhering to ions is out of commission as far as functions
of the free water go. Only a fraction of the free water is available to solvate the added
ions. That is, the effective concentration is increased compared with that which one
would calculate if one assumed all the water was active. Thus, in the “concentration”
calculation (so and so many moles of ions per liter of water), it is implicitly assumed that
all the water molecules are “active.” Suppose half the water molecules are temporarily
associated with ions; then the effective concentration (i.e., the activity) is doubled.
Of course, in this simplified presentation, one assumes that by the time the
concentration is so high that the activity coefficient–concentration relation turns
upward (Fig. 2.18), the interionic interaction effects, although still there, have been
overwhelmed by the effect of ions in reducing free waters. In reality, both this effect
and the interionic effects that dominated at lower concentrations (below the minimum)
should be taken into account.
By now, the reader will begin to see the point, and how all this is related to
determining hydration number. In Chapter 3, a quantitative expression between this