
Page 259 - MODERN ELECTROCHEMISTRY
P. 259
ION–SOLVENT INTERACTIONS 195
One can then use the time course of the fluorescence decay. The change in
frequency of the emitted light compared with that of the incident light contains
information from which the rotational and internal dynamics can be studied.
The rotational frequency in lysozomes decreases with increase of water. This type
of study throws some light on protein–micellar interactions and how they are affected
by hydration.
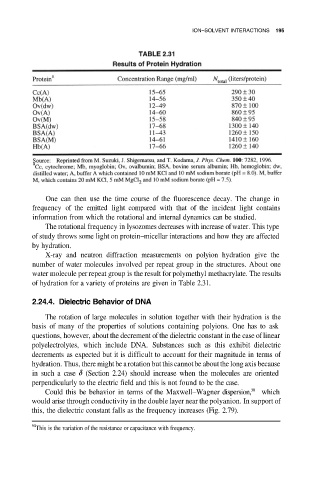
X-ray and neutron diffraction measurements on polyion hydration give the
number of water molecules involved per repeat group in the structures. About one
water molecule per repeat group is the result for polymethyl methacrylate. The results
of hydration for a variety of proteins are given in Table 2.31.
2.24.4. Dielectric Behavior of DNA
The rotation of large molecules in solution together with their hydration is the
basis of many of the properties of solutions containing polyions. One has to ask
questions, however, about the decrement of the dielectric constant in the case of linear
polyelectrolytes, which include DNA. Substances such as this exhibit dielectric
decrements as expected but it is difficult to account for their magnitude in terms of
hydration. Thus, there might be a rotation but this cannot be about the long axis because
in such a case (Section 2.24) should increase when the molecules are oriented
perpendicularly to the electric field and this is not found to be the case.
50
Could this be behavior in terms of the Maxwell–Wagner dispersion, which
would arise through conductivity in the double layer near the polyanion. In support of
this, the dielectric constant falls as the frequency increases (Fig. 2.79).
50
This is the variation of the resistance or capacitance with frequency.