
Page 246 - Modern Optical Engineering The Design of Optical Systems
P. 246
226 Chapter Ten
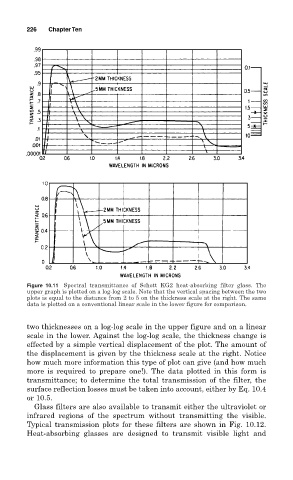
Figure 10.11 Spectral transmittance of Schott KG2 heat-absorbing filter glass. The
upper graph is plotted on a log-log scale. Note that the vertical spacing between the two
plots is equal to the distance from 2 to 5 on the thickness scale at the right. The same
data is plotted on a conventional linear scale in the lower figure for comparison.
two thicknesses on a log-log scale in the upper figure and on a linear
scale in the lower. Against the log-log scale, the thickness change is
effected by a simple vertical displacement of the plot. The amount of
the displacement is given by the thickness scale at the right. Notice
how much more information this type of plot can give (and how much
more is required to prepare one!). The data plotted in this form is
transmittance; to determine the total transmission of the filter, the
surface reflection losses must be taken into account, either by Eq. 10.4
or 10.5.
Glass filters are also available to transmit either the ultraviolet or
infrared regions of the spectrum without transmitting the visible.
Typical transmission plots for these filters are shown in Fig. 10.12.
Heat-absorbing glasses are designed to transmit visible light and