
Page 94 - Modern Optical Engineering The Design of Optical Systems
P. 94
The Primary Aberrations 77
The transverse measure of an aberration is directly related to the size
of the image blur. Graphing it as a ray intercept plot (e.g., Fig. 5.3b and
Fig. 5.24) allows the viewer to identify the various types of aberration
afflicting the optical system. This is of great value to the lens designer,
and the ray intercept plot of the transverse aberrations is an almost
universally used presentation of the aberrations. As discussed later (in
Chap. 15), the OPD, or wave-front deformation, is the most useful
measure of image quality for well-corrected systems, and a statement of
the amount of the OPD is usually accepted as definitive in this regard.
The longitudinal presentation of the aberrations is most useful in
understanding field curvature and axial chromatic (especially secondary
spectrum).
Coma
Coma can be defined as the variation of magnification with aperture.
Thus, when a bundle of oblique rays is incident on a lens with coma,
the rays passing through the edge portions of the lens may be imaged
at a different height than those passing through the center portion. In
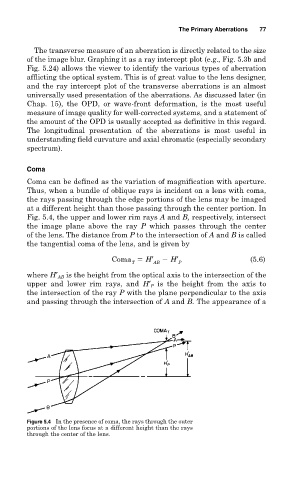
Fig. 5.4, the upper and lower rim rays A and B, respectively, intersect
the image plane above the ray P which passes through the center
of the lens. The distance from P to the intersection of A and B is called
the tangential coma of the lens, and is given by
Coma H′ H′ (5.6)
T AB P
where H′ AB is the height from the optical axis to the intersection of the
upper and lower rim rays, and H′ P is the height from the axis to
the intersection of the ray P with the plane perpendicular to the axis
and passing through the intersection of A and B. The appearance of a
Figure 5.4 In the presence of coma, the rays through the outer
portions of the lens focus at a different height than the rays
through the center of the lens.