
Page 36 - Modern Spatiotemporal Geostatistics
P. 36
Spatiotemporal Mapping in Natural Sciences 1 7
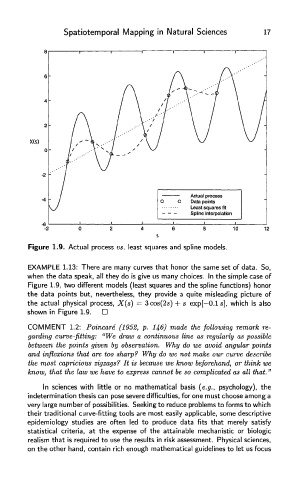
Figure 1.9. Actual process vs. least squares and spline models.
EXAMPLE 1.13: There are many curves that honor the same set of data. So,
when the data speak, all they do is give us many choices. In the simple case of
Figure 1.9, two different models (least squares and the spline functions) honor
the data points but, nevertheless, they provide a quite misleading picture of
the actual physical process, X(s) = 3cos(2s) + s exp[—O.ls], which is also
shown in Figure 1.9.
COMMENT 1.2 : Poincare (1952, p . 146) made th e following remark re-
garding curve-fitting: "We draw a continuous line as regularly as possible
between the points given by observation. Why do we avoid angular points
and inflexions that are too sharp? Why do we not make our curve describe
the most capricious zigzags? It is because we know beforehand, or think we
know, that the law we have to express cannot be so complicated as all that."
In sciences with little or no mathematical basis (e.g., psychology), the
indetermination thesis can pose severe difficulties, for one must choose among a
very large number of possibilities. Seeking to reduce problems to forms to which
their traditional curve-fitting tools are most easily applicable, some descriptive
epidemiology studies are often led to produce data fits that merely satisfy
statistical criteria, at the expense of the attainable mechanistic or biologic
realism that is required to use the results in risk assessment. Physical sciences,
on the other hand, contain rich enough mathematical guidelines to let us focus