
Page 101 - Multidimensional Chromatography
P. 101
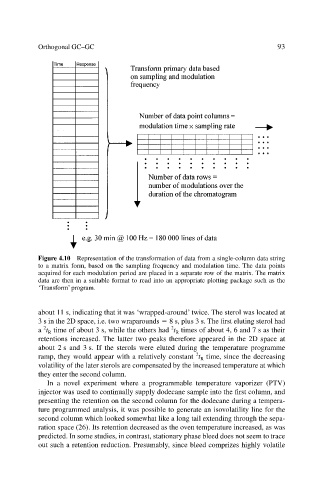
Orthogonal GC–GC                                                 93


                           Figure 4.10 Representation of the transformation of data from a single-column data string
                           to a matrix form, based on the sampling frequency and modulation time. The data points
                           acquired for each modulation period are placed in a separate row of the matrix. The matrix
                           data are then in a suitable format to read into an appropriate plotting package such as the
                           ‘Transform’ program.


                           about 11 s, indicating that it was ‘wrapped-around’ twice. The sterol was located at
                           3 s in the 2D space, i.e. two wraparounds   8 s, plus 3 s. The first eluting sterol had
                                                               2
                             2
                           a  t R time of about 3 s, while the others had  t R times of about 4, 6 and 7 s as their
                           retentions increased. The latter two peaks therefore appeared in the 2D space at
                           about 2 s and 3 s. If the sterols were eluted during the temperature programme
                                                                      2
                           ramp, they would appear with a relatively constant  t R time, since the decreasing
                           volatility of the later sterols are compensated by the increased temperature at which
                           they enter the second column.
                              In a novel experiment where a programmable temperature vaporizer (PTV)
                           injector was used to continually supply dodecane sample into the first column, and
                           presenting the retention on the second column for the dodecane during a tempera-
                           ture programmed analysis, it was possible to generate an isovolatility line for the
                           second column which looked somewhat like a long tail extending through the sepa-
                           ration space (26). Its retention decreased as the oven temperature increased, as was
                           predicted. In some studies, in contrast, stationary phase bleed does not seem to trace
                           out such a retention reduction. Presumably, since bleed comprizes highly volatile