
Page 105 - Multidimensional Chromatography
P. 105
Orthogonal GC–GC 97
interactions . . . independent of any dispersive interactions the two stationary phases
may have in common.
This statement refers to a non-polar first column and a more polar second
column.
The ordering of classes of compounds within the separation space was summa-
rized by Ledford et al. (33), who presented an analogy to the separation by using a
mixture of objects of varied shapes, colours and sizes. The experimental dimensions
could separate objects based on mechanisms which were sensitive to shape, size or
colour, and the choice of two of these for the two-dimensional separation was illus-
trated. Applications showed a variety of petroleum products on different column
sets, as well as a perfume sample.
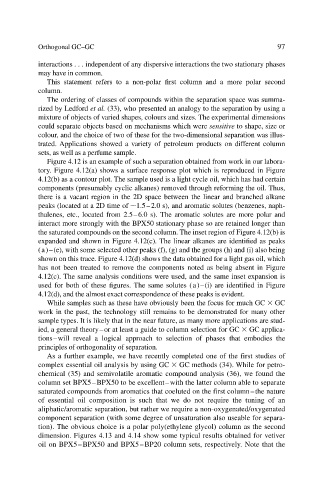
Figure 4.12 is an example of such a separation obtained from work in our labora-
tory. Figure 4.12(a) shows a surface response plot which is reproduced in Figure
4.12(b) as a contour plot. The sample used is a light cycle oil, which has had certain
components (presumably cyclic alkanes) removed through reforming the oil. Thus,
there is a vacant region in the 2D space between the linear and branched alkane
peaks (located at a 2D time of 1.5–2.0 s), and aromatic solutes (benzenes, naph-
thalenes, etc., located from 2.5–6.0 s). The aromatic solutes are more polar and
interact more strongly with the BPX50 stationary phase so are retained longer than
the saturated compounds on the second column. The inset region of Figure 4.12(b) is
expanded and shown in Figure 4.12(c). The linear alkanes are identified as peaks
(a)–(e), with some selected other peaks (f), (g) and the groups (h) and (i) also being
shown on this trace. Figure 4.12(d) shows the data obtained for a light gas oil, which
has not been treated to remove the components noted as being absent in Figure
4.12(c). The same analysis conditions were used, and the same inset expansion is
used for both of these figures. The same solutes (a)–(i) are identified in Figure
4.12(d), and the almost exact correspondence of these peaks is evident.
While samples such as these have obviously been the focus for much GC GC
work in the past, the technology still remains to be demonstrated for many other
sample types. It is likely that in the near future, as many more applications are stud-
ied, a general theory–or at least a guide to column selection for GC GC applica-
tions–will reveal a logical approach to selection of phases that embodies the
principles of orthogonality of separation.
As a further example, we have recently completed one of the first studies of
complex essential oil analysis by using GC GC methods (34). While for petro-
chemical (35) and semivolatile aromatic compound analysis (36), we found the
column set BPX5–BPX50 to be excellent–with the latter column able to separate
saturated compounds from aromatics that coeluted on the first column–the nature
of essential oil composition is such that we do not require the tuning of an
aliphatic/aromatic separation, but rather we require a non-oxygenated/oxygenated
component separation (with some degree of unsaturation also useable for separa-
tion). The obvious choice is a polar poly(ethylene glycol) column as the second
dimension. Figures 4.13 and 4.14 show some typical results obtained for vetiver
oil on BPX5–BPX50 and BPX5–BP20 column sets, respectively. Note that the