
Page 108 - Multidimensional Chromatography
P. 108
100 Multidimensional Chromatography
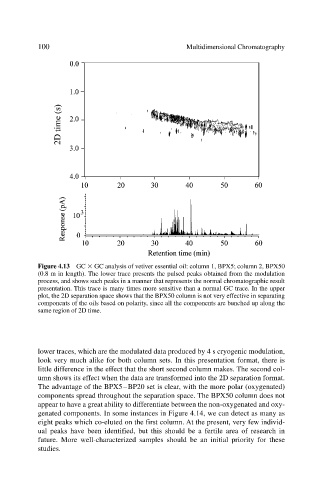
Figure 4.13 GC GC analysis of vetiver essential oil: column 1, BPX5; column 2, BPX50
(0.8 m in length). The lower trace presents the pulsed peaks obtained from the modulation
process, and shows such peaks in a manner that represents the normal chromatographic result
presentation. This trace is many times more sensitive than a normal GC trace. In the upper
plot, the 2D separation space shows that the BPX50 column is not very effective in separating
components of the oils based on polarity, since all the components are bunched up along the
same region of 2D time.
lower traces, which are the modulated data produced by 4 s cryogenic modulation,
look very much alike for both column sets. In this presentation format, there is
little difference in the effect that the short second column makes. The second col-
umn shows its effect when the data are transformed into the 2D separation format.
The advantage of the BPX5–BP20 set is clear, with the more polar (oxygenated)
components spread throughout the separation space. The BPX50 column does not
appear to have a great ability to differentiate between the non-oxygenated and oxy-
genated components. In some instances in Figure 4.14, we can detect as many as
eight peaks which co-eluted on the first column. At the present, very few individ-
ual peaks have been identified, but this should be a fertile area of research in
future. More well-characterized samples should be an initial priority for these
studies.