
Page 98 - Multidimensional Chromatography
P. 98
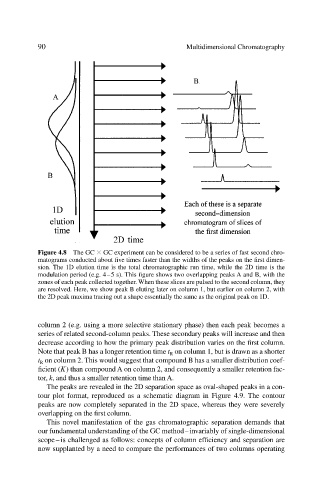
90                                      Multidimensional Chromatography


                           Figure 4.8 The GC   GC experiment can be considered to be a series of fast second chro-
                           matograms conducted about five times faster than the widths of the peaks on the first dimen-
                           sion. The 1D elution time is the total chromatographic run time, while the 2D time is the
                           modulation period (e.g. 4–5 s). This figure shows two overlapping peaks A and B, with the
                           zones of each peak collected together. When these slices are pulsed to the second column, they
                           are resolved. Here, we show peak B eluting later on column 1, but earlier on column 2, with
                           the 2D peak maxima tracing out a shape essentially the same as the original peak on 1D.


                           column 2 (e.g. using a more selective stationary phase) then each peak becomes a
                           series of related second-column peaks. These secondary peaks will increase and then
                           decrease according to how the primary peak distribution varies on the first column.
                           Note that peak B has a longer retention time t R on column 1, but is drawn as a shorter
                           t R on column 2. This would suggest that compound B has a smaller distribution coef-
                           ficient (K) than compound A on column 2, and consequently a smaller retention fac-
                           tor, k, and thus a smaller retention time than A.
                             The peaks are revealed in the 2D separation space as oval-shaped peaks in a con-
                           tour plot format, reproduced as a schematic diagram in Figure 4.9. The contour
                           peaks are now completely separated in the 2D space, whereas they were severely
                           overlapping on the first column.
                             This novel manifestation of the gas chromatographic separation demands that
                           our fundamental understanding of the GC method–invariably of single-dimensional
                           scope – is challenged as follows: concepts of column efficiency and separation are
                           now supplanted by a need to compare the performances of two columns operating