
Page 243 - Multidimensional Chromatography
P. 243
Foods, Flavours and Fragrances Applications 237
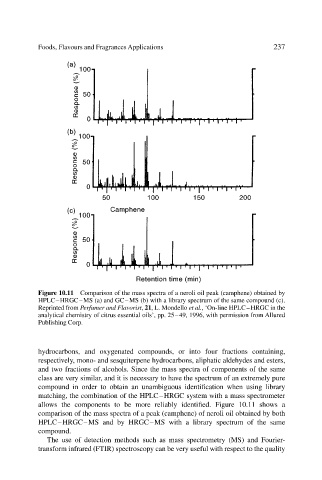
Figure 10.11 Comparison of the mass spectra of a neroli oil peak (camphene) obtained by
HPLC–HRGC–MS (a) and GC–MS (b) with a library spectrum of the same compound (c).
Reprinted from Perfumer and Flavorist, 21, L. Mondello et al., ‘On-line HPLC–HRGC in the
analytical chemistry of citrus essential oils’, pp. 25–49, 1996, with permission from Allured
Publishing Corp.
hydrocarbons, and oxygenated compounds, or into four fractions containing,
respectively, mono- and sesquiterpene hydrocarbons, aliphatic aldehydes and esters,
and two fractions of alcohols. Since the mass spectra of components of the same
class are very similar, and it is necessary to have the spectrum of an extremely pure
compound in order to obtain an unambiguous identification when using library
matching, the combination of the HPLC–HRGC system with a mass spectrometer
allows the components to be more reliably identified. Figure 10.11 shows a
comparison of the mass spectra of a peak (camphene) of neroli oil obtained by both
HPLC–HRGC–MS and by HRGC–MS with a library spectrum of the same
compound.
The use of detection methods such as mass spectrometry (MS) and Fourier-
transform infrared (FTIR) spectroscopy can be very useful with respect to the quality