
Page 279 - Multidimensional Chromatography
P. 279
274 Multidimensional Chromatography
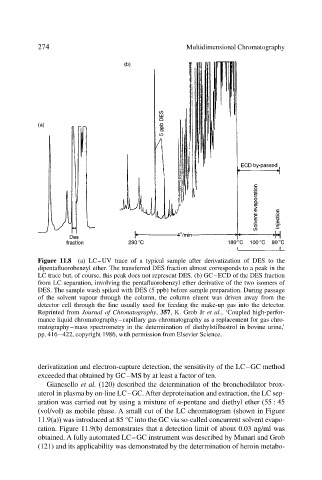
Figure 11.8 (a) LC–UV trace of a typical sample after derivatization of DES to the
dipentafluorobenzyl ether. The transferred DES fraction almost corresponds to a peak in the
LC trace but, of course, this peak does not represent DES. (b) GC–ECD of the DES fraction
from LC separation, involving the pentafluorobenzyl ether derivative of the two isomers of
DES. The sample wash spiked with DES (5 ppb) before sample preparation. During passage
of the solvent vapour through the column, the column eluent was driven away from the
detector cell through the line usually used for feeding the make-up gas into the detector.
Reprinted from Journal of Chronatography, 357, K. Grob Jr et al., ‘Coupled high-perfor-
mance liquid chromatography–capillary gas chromatography as a replacement for gas chro-
matography–mass spectrometry in the determination of diethylstilbestrol in bovine urine,’
pp. 416–422, copyright 1986, with permission from Elsevier Science.
derivatization and electron-capture detection, the sensitivity of the LC–GC method
exceeded that obtained by GC–MS by at least a factor of ten.
Gianesello et al. (120) described the determination of the bronchodilator brox-
aterol in plasma by on-line LC–GC. After deproteination and extraction, the LC sep-
aration was carried out by using a mixture of n-pentane and diethyl ether (55 : 45
(vol/vol) as mobile phase. A small cut of the LC chromatogram (shown in Figure
11.9(a)) was introduced at 85 °C into the GC via so-called concurrent solvent evapo-
ration. Figure 11.9(b) demonstrates that a detection limit of about 0.03 ng/ml was
obtained. A fully automated LC–GC instrument was described by Munari and Grob
(121) and its applicability was demonstrated by the determination of heroin metabo-