
Page 320 - Multidimensional Chromatography
P. 320
310 Multidimensional Chromatography
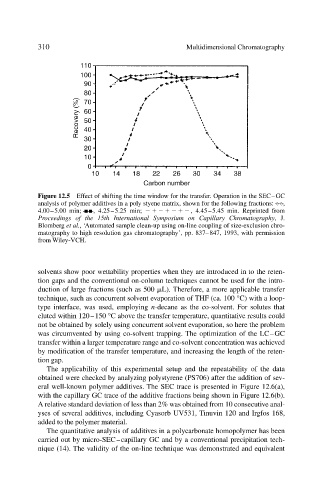
Figure 12.5 Effect of shifting the time window for the transfer. Operation in the SEC–GC
analysis of polymer additives in a poly styene matrix, shown for the following fractions: ,
4.00–5.00 min; , 4.25–5.25 min; , 4.45–5.45 min. Reprinted from
Proceedings of the 15th International Symposium on Capillary Chromatography,J.
Blomberg et al., ‘Automated sample clean-up using on-line coupling of size-exclusion chro-
matography to high resolution gas chromatography’, pp. 837–847, 1993, with permission
from Wiley-VCH.
solvents show poor wettability properties when they are introduced in to the reten-
tion gaps and the conventional on-column techniques cannot be used for the intro-
duction of large fractions (such as 500 L). Therefore, a more applicable transfer
technique, such as concurrent solvent evaporation of THF (ca. 100 °C) with a loop-
type interface, was used, employing n-decane as the co-solvent. For solutes that
eluted within 120–150 °C above the transfer temperature, quantitative results could
not be obtained by solely using concurrent solvent evaporation, so here the problem
was circumvented by using co-solvent trapping. The optimization of the LC–GC
transfer within a larger temperature range and co-solvent concentration was achieved
by modification of the transfer temperature, and increasing the length of the reten-
tion gap.
The applicability of this experimental setup and the repeatability of the data
obtained were checked by analyzing polystyrene (PS706) after the addition of sev-
eral well-known polymer additives. The SEC trace is presented in Figure 12.6(a),
with the capillary GC trace of the additive fractions being shown in Figure 12.6(b).
A relative standard deviation of less than 2% was obtained from 10 consecutive anal-
yses of several additives, including Cyasorb UV531, Tinuvin 120 and Irgfos 168,
added to the polymer material.
The quantitative analysis of additives in a polycarbonate homopolymer has been
carried out by micro-SEC–capillary GC and by a conventional precipitation tech-
nique (14). The validity of the on-line technique was demonstrated and equivalent