
Page 360 - Multidimensional Chromatography
P. 360
Multidimensional Chromatography in Environmental Analysis 351
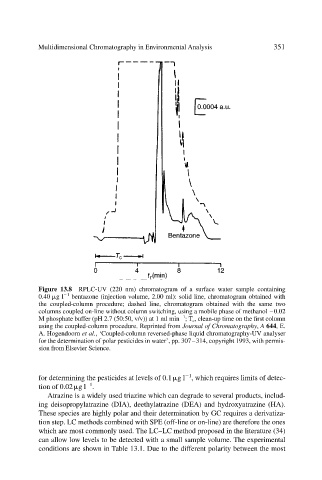
Figure 13.8 RPLC-UV (220 nm) chromatogram of a surface water sample containing
0.40 g l 1 bentazone (injection volume, 2.00 ml): solid line, chromatogram obtained with
the coupled-column procedure; dashed line, chromatogram obtained with the same two
columns coupled on-line without column switching, using a mobile phase of methanol –0.02
1
M phosphate buffer (pH 2.7 (50:50, v/v)) at 1 ml min ; T c , clean-up time on the first column
using the coupled-column procedure. Reprinted from Journal of Chromatography, A 644,E.
A. Hogendoorn et al., ‘Coupled-column reversed-phase liquid chromatography-UV analyser
for the determination of polar pesticides in water’, pp. 307–314, copyright 1993, with permis-
sion from Elsevier Science.
1
for determining the pesticides at levels of 0.1 g l , which requires limits of detec-
1
tion of 0.02 g l .
Atrazine is a widely used triazine which can degrade to several products, includ-
ing deisopropylatrazine (DIA), deethylatrazine (DEA) and hydroxyatrazine (HA).
These species are highly polar and their determination by GC requires a derivatiza-
tion step. LC methods combined with SPE (off-line or on-line) are therefore the ones
which are most commonly used. The LC–LC method proposed in the literature (34)
can allow low levels to be detected with a small sample volume. The experimental
conditions are shown in Table 13.1. Due to the different polarity between the most