
Page 503 - Book Hosokawa Nanoparticle Technology Handbook
P. 503
14 BARIUM TITANATE NANOPARTICLES SYNTHESIS APPLICATIONS
Tetragonal Cubic
0.5
380°C
0.45
350°C
FWHM (rad) 0.35 25MPa 40MPa
(e) 0.4 300°C
(d)
Intensity (a.u.) (c) 0.25 20MPa 420°C 30MPa 35MPa
0.3
400°C
(b) 0.2
0 0.2 0.4 0.6 0.8
3
Water density (g/cm )
(a)
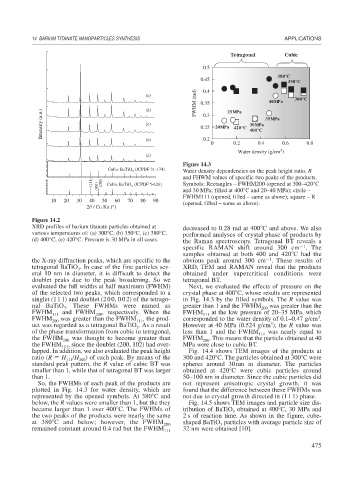
Figure 14.3
Cubic BaTiO (JCPDF 31-174)
Cubi
3 Water density dependencies on the peak height ratio, R
and FHWM values of specific two peaks of the products.
(111) (001) (200) Cubic BaTiO (JCPDF 5-626) Symbols: Rectangles – FWHM200 (opened at 300–420°C
3
and 30 MPa; filled at 400°C and 20–40 MPa); circle –
FWHM111 (opened, filled – same as above); square – R
10 20 30 40 50 60 70 80 90 (opened, filled – same as above).
2 / Cu K (°)
Figure 14.2
XRD profiles of barium titanate particles obtained at decreased to 0.28 rad at 400 C and above. We also
various temperatures of: (a) 300°C, (b) 350°C, (c) 380°C, performed analyses of crystal phase of products by
(d) 400°C, (e) 420°C. Pressure is 30 MPa in all cases. the Raman spectroscopy. Tetragonal BT reveals a
1
specific RAMAN shift around 300 cm . The
samples obtained at both 400 and 420 C had the
1
the X-ray diffraction peaks, which are specific to the obvious peak around 300 cm . These results of
tetragonal BaTiO . In case of the fine particles sev- XRD, TEM and RAMAN reveal that the products
3
eral 10 nm in diameter, it is difficult to detect the obtained under supercritical conditions were
doublet peaks due to the peak broadening. So we tetragonal BT.
evaluated the full widths at half maximum (FWHM) Next, we evaluated the effects of pressure on the
of the selected two peaks, which corresponded to a crystal phase at 400 C, whose results are represented
singlet (111) and doublet (200, 002) of the tetrago- in Fig. 14.3 by the filled symbols. The R value was
nal BaTiO . These FWHMs were named as greater than 1 and the FWHM 200 was greater than the
3
FWHM 111 and FWHM , respectively. When the FWHM 111 at the low pressure of 20–35 MPa, which
200
3
FWHM 200 was greater than the FWHM , the prod- corresponded to the water density of 0.1–0.47 g/cm .
111
3
uct was regarded as a tetragonal BaTiO . As a result However at 40 MPa (0.524 g/cm ), the R value was
3
of the phase transformation from cubic to tetragonal, less than 1 and the FWHM 111 was nearly equal to
the FWHM 200 was thought to become greater than FWHM . This means that the particle obtained at 40
200
the FWHM , since the doublet (200, 102) had over- MPa were close to cubic BT.
111
lapped. In addition, we also evaluated the peak height Fig. 14.4 shows TEM images of the products at
ratio (R H /H ) of each peak. By means of the 300 and 420 C. The particles obtained at 300 C were
111
200
standard peak pattern, the R value of cubic BT was spheres around 30nm in diameter. The particles
smaller than 1, while that of tetragonal BT was larger obtained at 420 C were cubic particles around
than 1. 50–100 nm in diameter. Since the cubic particles did
So, the FWHMs of each peak of the products are not represent anisotropic crystal growth, it was
plotted in Fig. 14.3 for water density, which are found that the difference between these FWHMs was
represented by the opened symbols. At 380 C and not due to crystal growth directed in (111) phase.
below, the R values were smaller than 1, but the they Fig. 14.5 shows TEM images and particle size dis-
became larger than 1 over 400 C. The FWHMs of tribution of BaTiO obtained at 400 C, 30 MPa and
3
the two peaks of the products were nearly the same 2 s of reaction time. As shown in the figure, cube-
at 380 C and below; however, the FWHM 200 shaped BaTiO particles with average particle size of
3
remained constant around 0.4 rad but the FWHM 111 32 nm were obtained [10].
475