
Page 241 - New Trends in Eco efficient and Recycled Concrete
P. 241
Life cycle assessment applied to recycled aggregate concrete 209
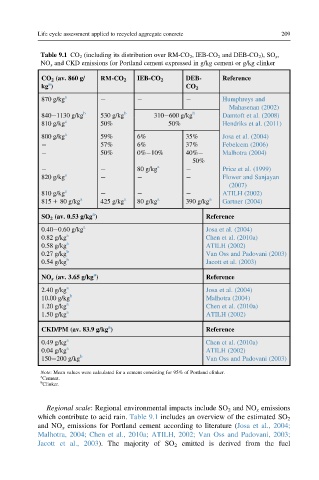
Table 9.1 CO 2 (including its distribution over RM-CO 2 , IEB-CO 2 and DEB-CO 2 ), SO x ,
NO x and CKD emissions for Portland cement expressed in g/kg cement or g/kg clinker
CO 2 (av. 860 g/ RM-CO 2 IEB-CO 2 DEB- Reference
a
kg ) CO 2
870 g/kg a Humphreys and
Mahasenan (2002)
840 1130 g/kg b 530 g/kg b 310 600 g/kg b Damtoft et al. (2008)
810 g/kg a 50% 50% Hendriks et al. (2011)
800 g/kg a 59% 6% 35% Josa et al. (2004)
57% 6% 37% Febelcem (2006)
50% 0% 10% 40% Malhotra (2004)
50%
80 g/kg a Price et al. (1999)
820 g/kg a Flower and Sanjayan
(2007)
810 g/kg a ATILH (2002)
815 1 80 g/kg a 425 g/kg a 80 g/kg a 390 g/kg a Gartner (2004)
a
SO 2 (av. 0.53 g/kg ) Reference
0.40 0.60 g/kg a Josa et al. (2004)
0.82 g/kg a Chen et al. (2010a)
0.58 g/kg a ATILH (2002)
0.27 g/kg b Van Oss and Padovani (2003)
0.54 g/kg b Jacott et al. (2003)
a
NO x (av. 3.65 g/kg ) Reference
2.40 g/kg a Josa et al. (2004)
10.00 g/kg b Malhotra (2004)
1.20 g/kg a Chen et al. (2010a)
1.50 g/kg a ATILH (2002)
a
CKD/PM (av. 83.9 g/kg ) Reference
0.49 g/kg a Chen et al. (2010a)
0.04 g/kg a ATILH (2002)
150 200 g/kg b Van Oss and Padovani (2003)
Note: Mean values were calculated for a cement consisting for 95% of Portland clinker.
a
Cement.
b
Clinker.
Regional scale: Regional environmental impacts include SO 2 and NO x emissions
which contribute to acid rain. Table 9.1 includes an overview of the estimated SO 2
and NO x emissions for Portland cement according to literature (Josa et al., 2004;
Malhotra, 2004; Chen et al., 2010a; ATILH, 2002; Van Oss and Padovani, 2003;
Jacott et al., 2003). The majority of SO 2 emitted is derived from the fuel