
Page 299 - New Trends in Eco efficient and Recycled Concrete
P. 299
Comparative studies of the life cycle analysis between conventional and recycled aggregate concrete 263
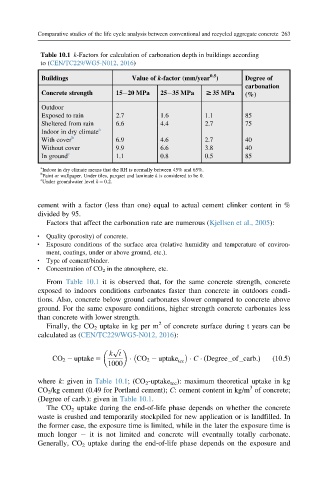
Table 10.1 k-Factors for calculation of carbonation depth in buildings according
to (CEN/TC229/WG5-N012, 2016)
0.5
Buildings Value of k-factor (mm/year ) Degree of
carbonation
Concrete strength 15 20 MPa 25 35 MPa $ 35 MPa (%)
Outdoor
Exposed to rain 2.7 1.6 1.1 85
Sheltered from rain 6.6 4.4 2.7 75
Indoor in dry climate a
With cover b 6.9 4.6 2.7 40
Without cover 9.9 6.6 3.8 40
In ground c 1.1 0.8 0.5 85
a
Indoor in dry climate means that the RH is normally between 45% and 65%.
b
Paint or wallpaper. Under tiles, parquet and laminate k is considered to be 0.
c
Under groundwater level k 5 0.2.
cement with a factor (less than one) equal to actual cement clinker content in %
divided by 95.
Factors that affect the carbonation rate are numerous (Kjellsen et al., 2005):
Quality (porosity) of concrete.
Exposure conditions of the surface area (relative humidity and temperature of environ-
ment, coatings, under or above ground, etc.).
Type of cement/binder.
Concentration of CO 2 in the atmosphere, etc.
From Table 10.1 it is observed that, for the same concrete strength, concrete
exposed to indoors conditions carbonates faster than concrete in outdoors condi-
tions. Also, concrete below ground carbonates slower compared to concrete above
ground. For the same exposure conditions, higher strength concrete carbonates less
than concrete with lower strength.
2
Finally, the CO 2 uptake in kg per m of concrete surface during t years can be
calculated as (CEN/TC229/WG5-N012, 2016):
p
ffiffi
k t
CO 2 2 uptake 5 CO 2 2 uptake tcc C Degree of carb:ð Þ (10.5)
1000
where k: given in Table 10.1; (CO 2 -uptake tcc ): maximum theoretical uptake in kg
3
CO 2 /kg cement (0.49 for Portland cement); C: cement content in kg/m of concrete;
(Degree of carb.): given in Table 10.1.
The CO 2 uptake during the end-of-life phase depends on whether the concrete
waste is crushed and temporarily stockpiled for new application or is landfilled. In
the former case, the exposure time is limited, while in the later the exposure time is
much longer it is not limited and concrete will eventually totally carbonate.
Generally, CO 2 uptake during the end-of-life phase depends on the exposure and