
Page 107 - Numerical Analysis and Modelling in Geomechanics
P. 107
88 D.S.JENG
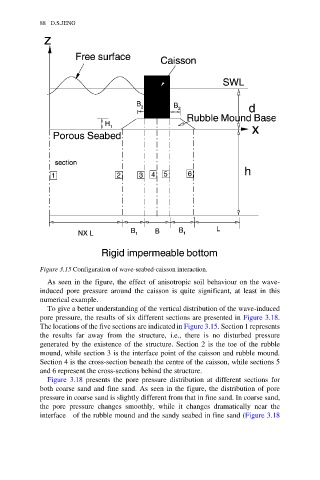
Figure 3.15 Configuration of wave-seabed-caisson interaction.
As seen in the figure, the effect of anisotropic soil behaviour on the wave-
induced pore pressure around the caisson is quite significant, at least in this
numerical example.
To give a better understanding of the vertical distribution of the wave-induced
pore pressure, the results of six different sections are presented in Figure 3.18.
The locations of the five sections are indicated in Figure 3.15. Section 1 represents
the results far away from the structure, i.e., there is no disturbed pressure
generated by the existence of the structure. Section 2 is the toe of the rubble
mound, while section 3 is the interface point of the caisson and rubble mound.
Section 4 is the cross-section beneath the centre of the caisson, while sections 5
and 6 represent the cross-sections behind the structure.
Figure 3.18 presents the pore pressure distribution at different sections for
both coarse sand and fine sand. As seen in the figure, the distribution of pore
pressure in coarse sand is slightly different from that in fine sand. In coarse sand,
the pore pressure changes smoothly, while it changes dramatically near the
interface of the rubble mound and the sandy seabed in fine sand (Figure 3.18