
Page 109 - Numerical Analysis and Modelling in Geomechanics
P. 109
90 D.S.JENG
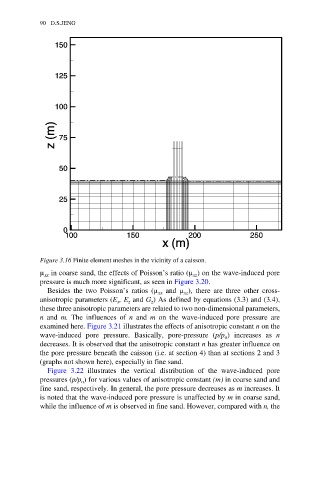
Figure 3.16 Finite element meshes in the vicinity of a caisson.
µ in coarse sand, the effects of Poisson’s ratio (µ ) on the wave-induced pore
xz
xx
pressure is much more significant, as seen in Figure 3.20.
Besides the two Poisson’s ratios (µ xx and µ ), there are three other cross-
xz
anisotropic parameters (E , E and G ) As defined by equations (3.3) and (3.4),
z
x
z
these three anisotropic parameters are related to two non-dimensional parameters,
n and m. The influences of n and m on the wave-induced pore pressure are
examined here. Figure 3.21 illustrates the effects of anisotropic constant n on the
wave-induced pore pressure. Basically, pore-pressure (p/p ) increases as n
o
decreases. It is observed that the anisotropic constant n has greater influence on
the pore pressure beneath the caisson (i.e. at section 4) than at sections 2 and 3
(graphs not shown here), especially in fine sand.
Figure 3.22 illustrates the vertical distribution of the wave-induced pore
pressures (p/p ) for various values of anisotropic constant (m) in coarse sand and
o
fine sand, respectively. In general, the pore pressure decreases as m increases. It
is noted that the wave-induced pore pressure is unaffected by m in coarse sand,
while the influence of m is observed in fine sand. However, compared with n, the