
Page 213 - Numerical Analysis and Modelling in Geomechanics
P. 213
194 ANNAMARIA CIVIDINI AND GIANCARLO GIODA
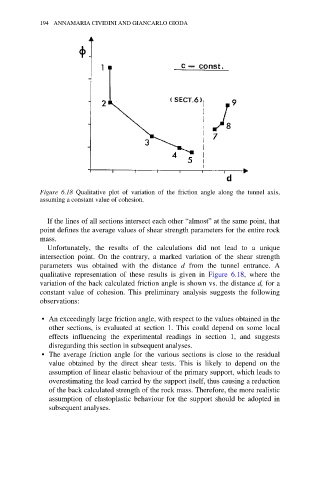
Figure 6.18 Qualitative plot of variation of the friction angle along the tunnel axis,
assuming a constant value of cohesion.
If the lines of all sections intersect each other “almost” at the same point, that
point defines the average values of shear strength parameters for the entire rock
mass.
Unfortunately, the results of the calculations did not lead to a unique
intersection point. On the contrary, a marked variation of the shear strength
parameters was obtained with the distance d from the tunnel entrance. A
qualitative representation of these results is given in Figure 6.18, where the
variation of the back calculated friction angle is shown vs. the distance d, for a
constant value of cohesion. This preliminary analysis suggests the following
observations:
• An exceedingly large friction angle, with respect to the values obtained in the
other sections, is evaluated at section 1. This could depend on some local
effects influencing the experimental readings in section 1, and suggests
disregarding this section in subsequent analyses.
• The average friction angle for the various sections is close to the residual
value obtained by the direct shear tests. This is likely to depend on the
assumption of linear elastic behaviour of the primary support, which leads to
overestimating the load carried by the support itself, thus causing a reduction
of the back calculated strength of the rock mass. Therefore, the more realistic
assumption of elastoplastic behaviour for the support should be adopted in
subsequent analyses.