
Page 216 - Numerical Analysis and Modelling in Geomechanics
P. 216
BACK ANALYSIS OF GEOTECHNICAL PROBLEMS 197
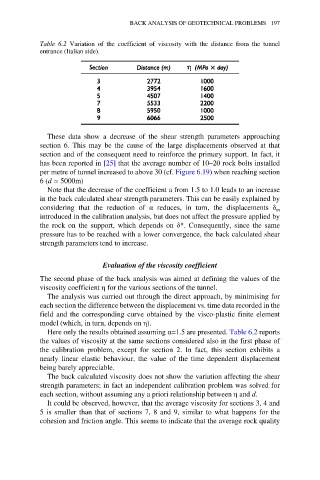
Table 6.2 Variation of the coefficient of viscosity with the distance from the tunnel
entrance (Italian side).
These data show a decrease of the shear strength parameters approaching
section 6. This may be the cause of the large displacements observed at that
section and of the consequent need to reinforce the primary support. In fact, it
has been reported in [25] that the average number of 10–20 rock bolts installed
per metre of tunnel increased to above 30 (cf. Figure 6.19) when reaching section
6 (d 5000m)
Note that the decrease of the coefficient a from 1.5 to 1.0 leads to an increase
in the back calculated shear strength parameters. This can be easily explained by
considering that the reduction of α reduces, in turn, the displacements δ m
introduced in the calibration analysis, but does not affect the pressure applied by
the rock on the support, which depends on δ*. Consequently, since the same
pressure has to be reached with a lower convergence, the back calculated shear
strength parameters tend to increase.
Evaluation of the viscosity coefficient
The second phase of the back analysis was aimed at defining the values of the
viscosity coefficient η for the various sections of the tunnel.
The analysis was carried out through the direct approach, by minimising for
each section the difference between the displacement vs. time data recorded in the
field and the corresponding curve obtained by the visco-plastic finite element
model (which, in turn, depends on η).
Here only the results obtained assuming α=1.5 are presented. Table 6.2 reports
the values of viscosity at the same sections considered also in the first phase of
the calibration problem, except for section 2. In fact, this section exhibits a
nearly linear elastic behaviour, the value of the time dependent displacement
being barely appreciable.
The back calculated viscosity does not show the variation affecting the shear
strength parameters; in fact an independent calibration problem was solved for
each section, without assuming any a priori relationship between η and d.
It could be observed, however, that the average viscosity for sections 3, 4 and
5 is smaller than that of sections 7, 8 and 9, similar to what happens for the
cohesion and friction angle. This seems to indicate that the average rock quality