
Page 248 - Numerical Analysis and Modelling in Geomechanics
P. 248
F.PERGALANI, V.PETRINI, A.PUGLIESE AND T.SANÒ 229
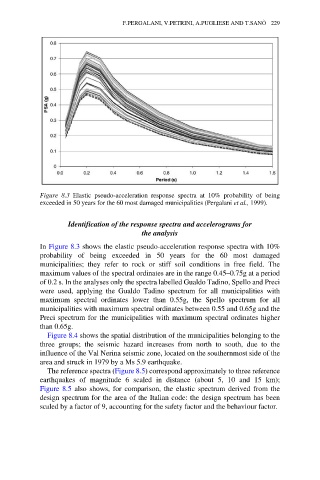
Figure 8.3 Elastic pseudo-acceleration response spectra at 10% probability of being
exceeded in 50 years for the 60 most damaged municipalities (Pergalani et al., 1999).
Identification of the response spectra and accelerograms for
the analysis
In Figure 8.3 shows the elastic pseudo-acceleration response spectra with 10%
probability of being exceeded in 50 years for the 60 most damaged
municipalities; they refer to rock or stiff soil conditions in free field. The
maximum values of the spectral ordinates are in the range 0.45–0.75g at a period
of 0.2 s. In the analyses only the spectra labelled Gualdo Tadino, Spello and Preci
were used, applying the Gualdo Tadino spectrum for all municipalities with
maximum spectral ordinates lower than 0.55g, the Spello spectrum for all
municipalities with maximum spectral ordinates between 0.55 and 0.65g and the
Preci spectrum for the municipalities with maximum spectral ordinates higher
than 0.65g.
Figure 8.4 shows the spatial distribution of the municipalities belonging to the
three groups; the seismic hazard increases from north to south, due to the
influence of the Val Nerina seismic zone, located on the southernmost side of the
area and struck in 1979 by a Ms 5.9 earthquake.
The reference spectra (Figure 8.5) correspond approximately to three reference
earthquakes of magnitude 6 scaled in distance (about 5, 10 and 15 km);
Figure 8.5 also shows, for comparison, the elastic spectrum derived from the
design spectrum for the area of the Italian code: the design spectrum has been
scaled by a factor of 9, accounting for the safety factor and the behaviour factor.