Page 376 - Numerical Analysis and Modelling in Geomechanics
P. 376
RESERVOIR COMPACTION, SUBSIDENCE AND WELL DAMAGE 357


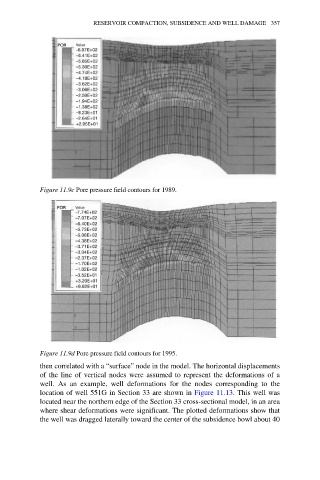
            Figure 11.9c Pore pressure field contours for 1989.


            Figure 11.9d Pore pressure field contours for 1995.
            then correlated with a “surface” node in the model. The horizontal displacements
            of  the  line  of  vertical  nodes  were  assumed  to  represent  the  deformations  of  a
            well.  As  an  example,  well  deformations  for  the  nodes  corresponding  to  the
            location of well 551G in Section 33 are shown in Figure 11.13. This well was
            located near the northern edge of the Section 33 cross-sectional model, in an area
            where shear deformations were significant. The plotted deformations show that
            the well was dragged laterally toward the center of the subsidence bowl about 40

