
Page 71 - Numerical Analysis and Modelling in Geomechanics
P. 71
52 A.A.JAVADI
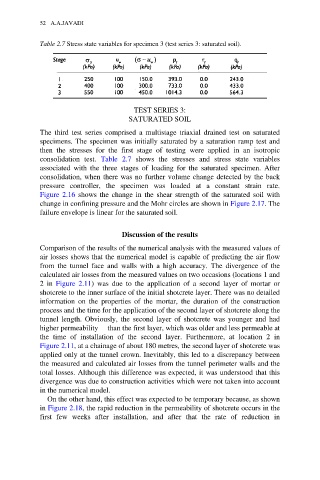
Table 2.7 Stress state variables for specimen 3 (test series 3: saturated soil).
TEST SERIES 3:
SATURATED SOIL
The third test series comprised a multistage triaxial drained test on saturated
specimens. The specimen was initially saturated by a saturation ramp test and
then the stresses for the first stage of testing were applied in an isotropic
consolidation test. Table 2.7 shows the stresses and stress state variables
associated with the three stages of loading for the saturated specimen. After
consolidation, when there was no further volume change detected by the back
pressure controller, the specimen was loaded at a constant strain rate.
Figure 2.16 shows the change in the shear strength of the saturated soil with
change in confining pressure and the Mohr circles are shown in Figure 2.17. The
failure envelope is linear for the saturated soil.
Discussion of the results
Comparison of the results of the numerical analysis with the measured values of
air losses shows that the numerical model is capable of predicting the air flow
from the tunnel face and walls with a high accuracy. The divergence of the
calculated air losses from the measured values on two occasions (locations 1 and
2 in Figure 2.11) was due to the application of a second layer of mortar or
shotcrete to the inner surface of the initial shotcrete layer. There was no detailed
information on the properties of the mortar, the duration of the construction
process and the time for the application of the second layer of shotcrete along the
tunnel length. Obviously, the second layer of shotcrete was younger and had
higher permeability than the first layer, which was older and less permeable at
the time of installation of the second layer. Furthermore, at location 2 in
Figure 2.11, at a chainage of about 180 metres, the second layer of shotcrete was
applied only at the tunnel crown. Inevitably, this led to a discrepancy between
the measured and calculated air losses from the tunnel perimeter walls and the
total losses. Although this difference was expected, it was understood that this
divergence was due to construction activities which were not taken into account
in the numerical model.
On the other hand, this effect was expected to be temporary because, as shown
in Figure 2.18, the rapid reduction in the permeability of shotcrete occurs in the
first few weeks after installation, and after that the rate of reduction in